Chapter 16 Chapter Title
Data Integration, This chapter is about some of the more practical aspects implementing GIS in a workflow. What type of problems and pitfalls might you encounter and how do you account for them?
This chapter will walk you through a number of things you will encounter when working in GIS, using an an applied example as a guide. Then you will be presented with two other case studies showing you example workflow. One will show how the police involved deaths data presented in Chapter 3 was compiled. The second will show (forest stuff - second case study - need guidance on how to include). (Skeeter et al. 2021 - Arctic Science).
Learning Objectives
- Objective one
- Objective two
- Objective three
Key Terms
Data, Integration, Other Stuff
16.1 The GIS Research Process
There are six basic steps to the GIS research process

Maybe insert Web-map showing site instead
16.2 Problems with data integration
Most GIS projects require us to analyze multiple data layers, sometimes from disparate sources to answer our research question. When working with different layers from different sources you are likely to encounter multiple incongruousness. What do you do if some of your layers are in vector format and some in raster? What if one of your datasets is 10 years older than another? How do you handle data that were collected at different resolutions or scales stored in different file types? These are questions that pop up every day when working in GIS.
We will discuss what to do when you encounter different:
1) Data types, sources, formats
2) Data resolutions
3) Datum, extents, scales
4) Time periods, collection dates
16.3 Frame the Problem
For millennia, wetlands in the Arctic have been sequestering Carbon. Permafrost (frozen ground) causes dead organic matter to freeze into the soil before it can fully decompose. Climate change in the Arctic is causing permafrost to degrade. This will speed up decomposition of and could result in a large pulse of greenhouse gasses being released back into the atmosphere. Creating a positive feedback mechanism that further exacerbates warming. Monitoring Arctic ecosystems is difficult due to the harsh conditions and inaccessibility of most locations, so little is known about these wetlands may respond to climate change.
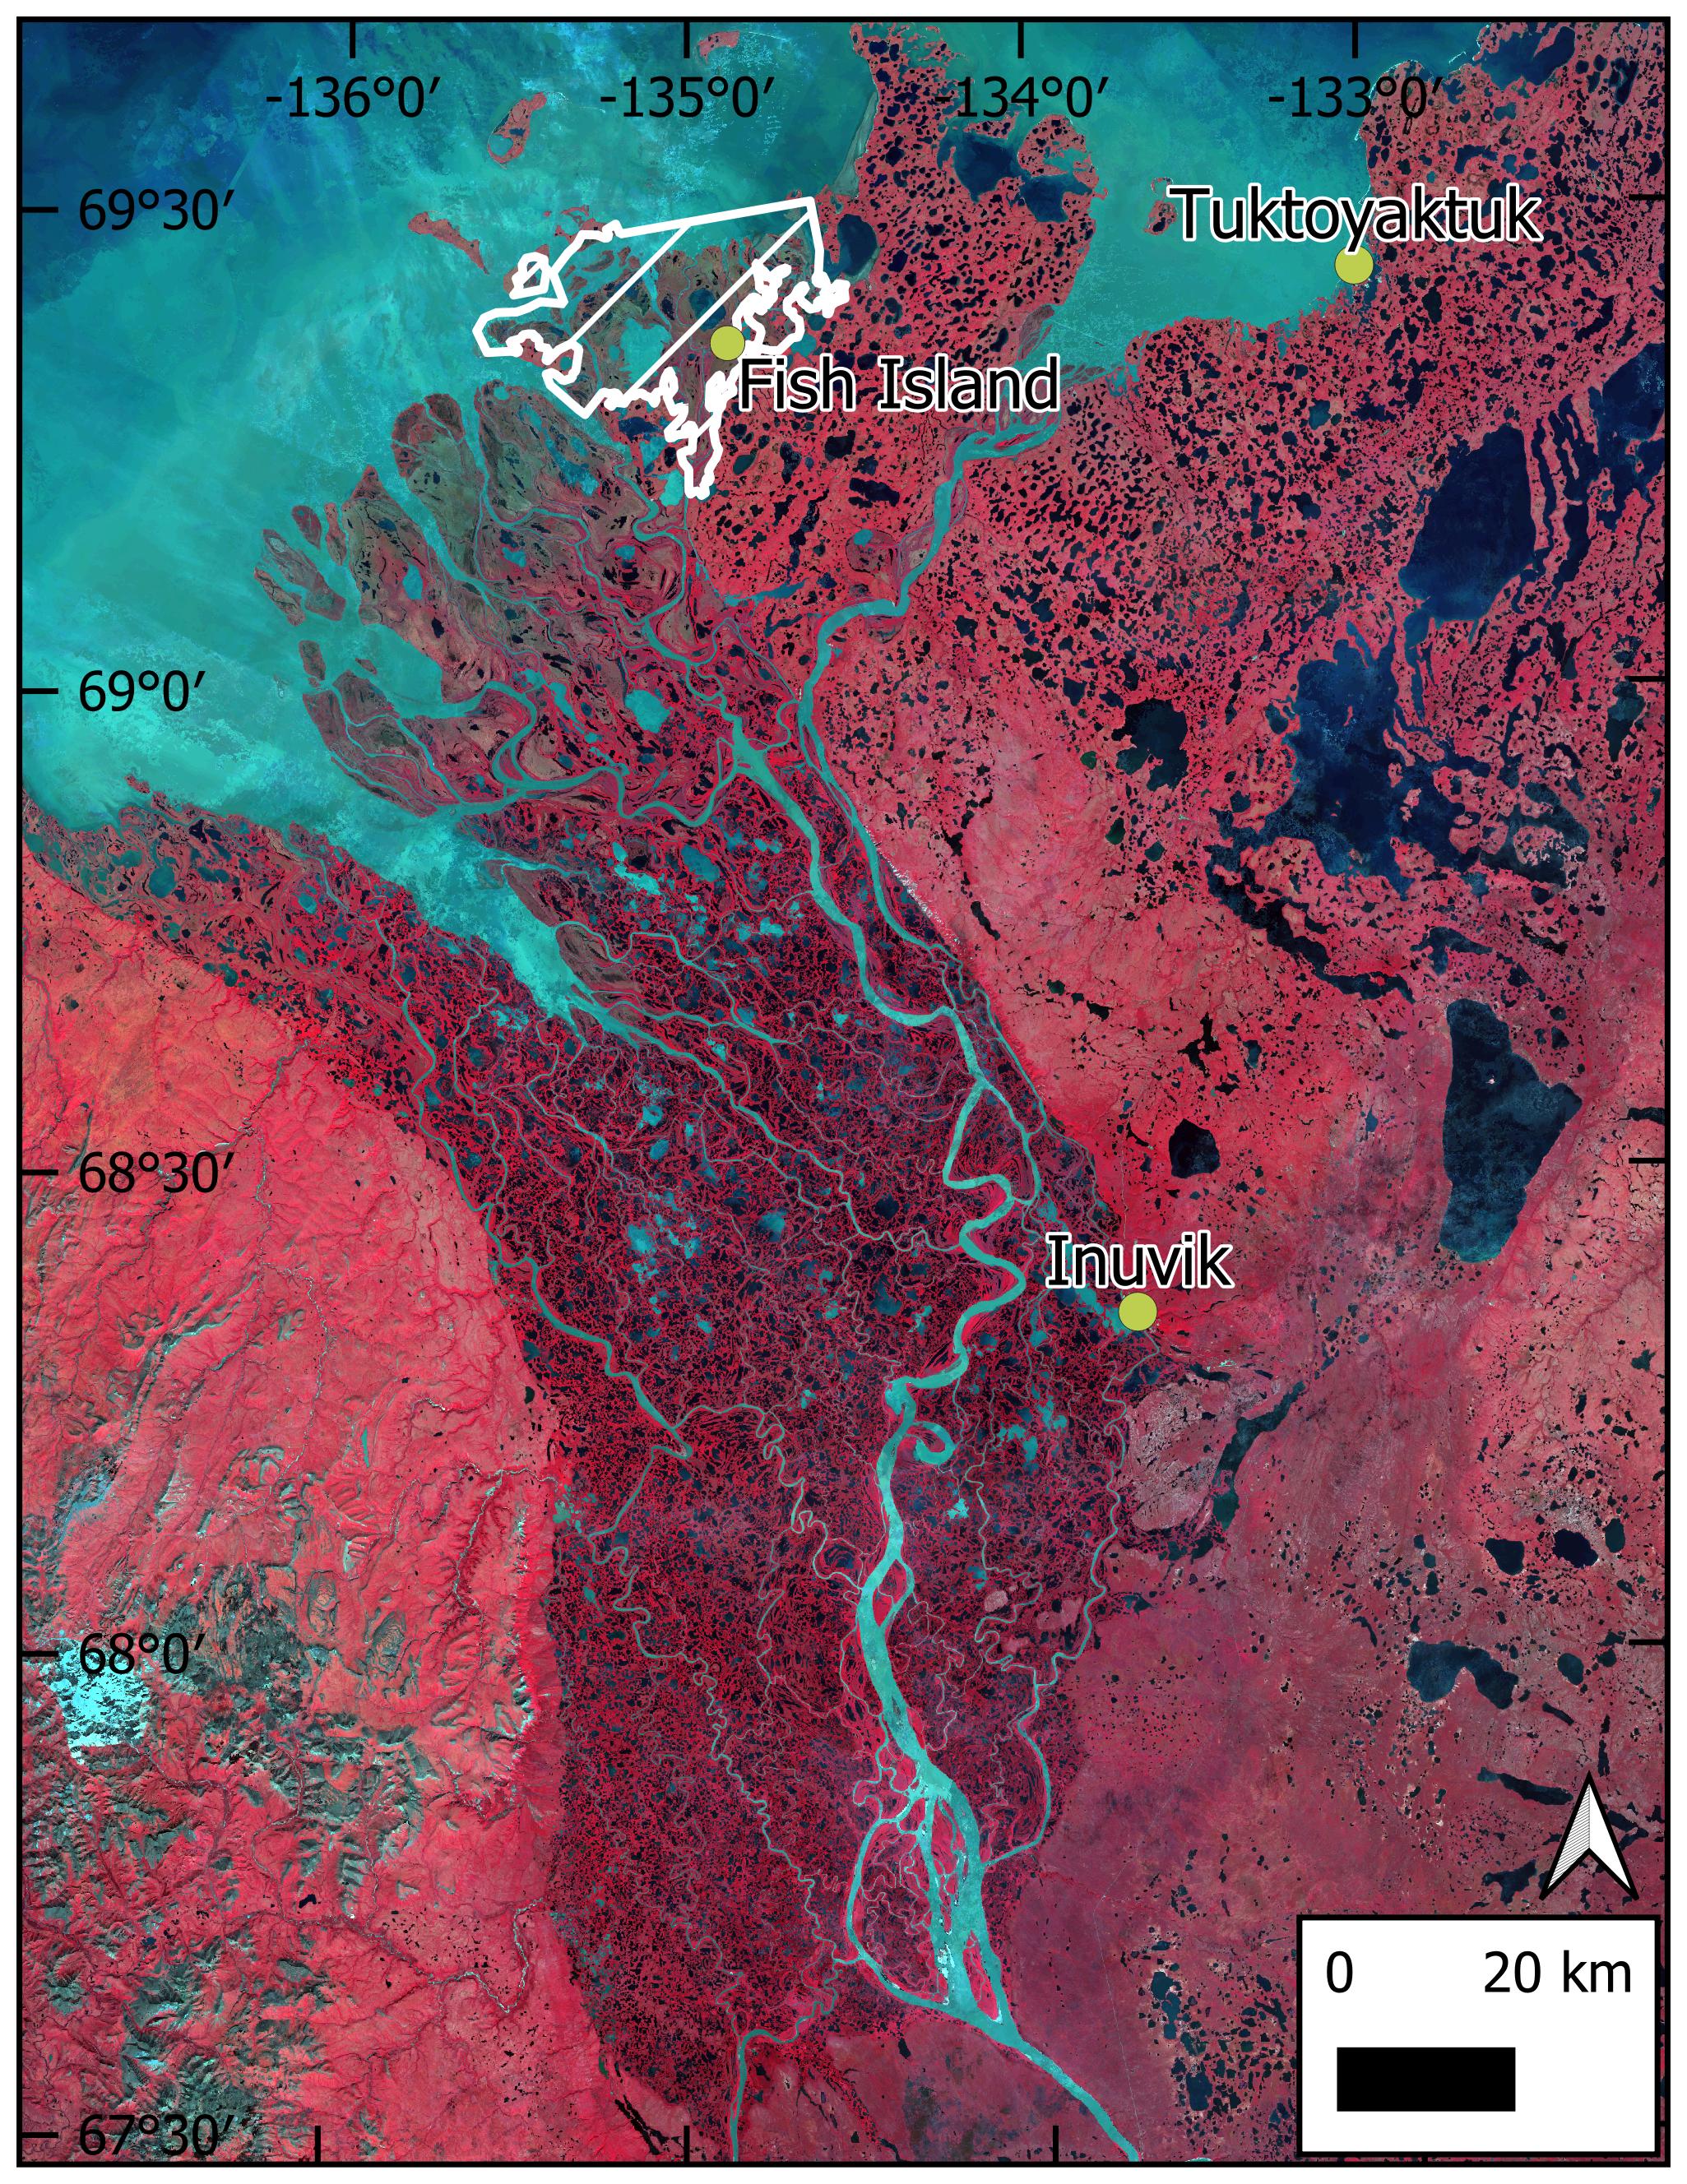
The MacKenzie Delta (12,000 km2), in the Northwest Territories is the second largest Arctic Delta in the world. It is a patchwork of channels, lakes, wetlands, and boreal forests. Permafrost in the delta is rich in organic matter that is vulnerable to climate change. This part of the arctic is also one of the fastest warming regions on earth. To date, only one ground based observation of landscape level Carbon exchange has been made anywhere in the Mackenzie Delta. In the summer of 2017 a field study was conducted using a method known as Eddy Covariance to measure the uptake/emission of Carbon Dioxide (CO2) at a wetland site in the Mackenzie Delta called Fish Island (Skeeter et al. 2021). Eddy covariance measures wind speeds/direction and (CO2) concentration which allowed us to calculate the net exchange CO2 in 30 minute intervals over the 2017 season and identify the main controls over CO2 exchange (radiation, soil temperature, etc.).
In the site was a Carbon sink in the summer of 2017. But, Arctic climates are characterized by extreme inter-annual variation so one year alone cannot be used determine a sites carbon balance. Unfortunately, due to funding issues, Fish Island site was shutdown after just one season. How can we use incorporate more data from other sources to investigate the role of inter-annual climate variability on the carbon balance and Fish Island and
16.3.1 Identify and Acquire Data
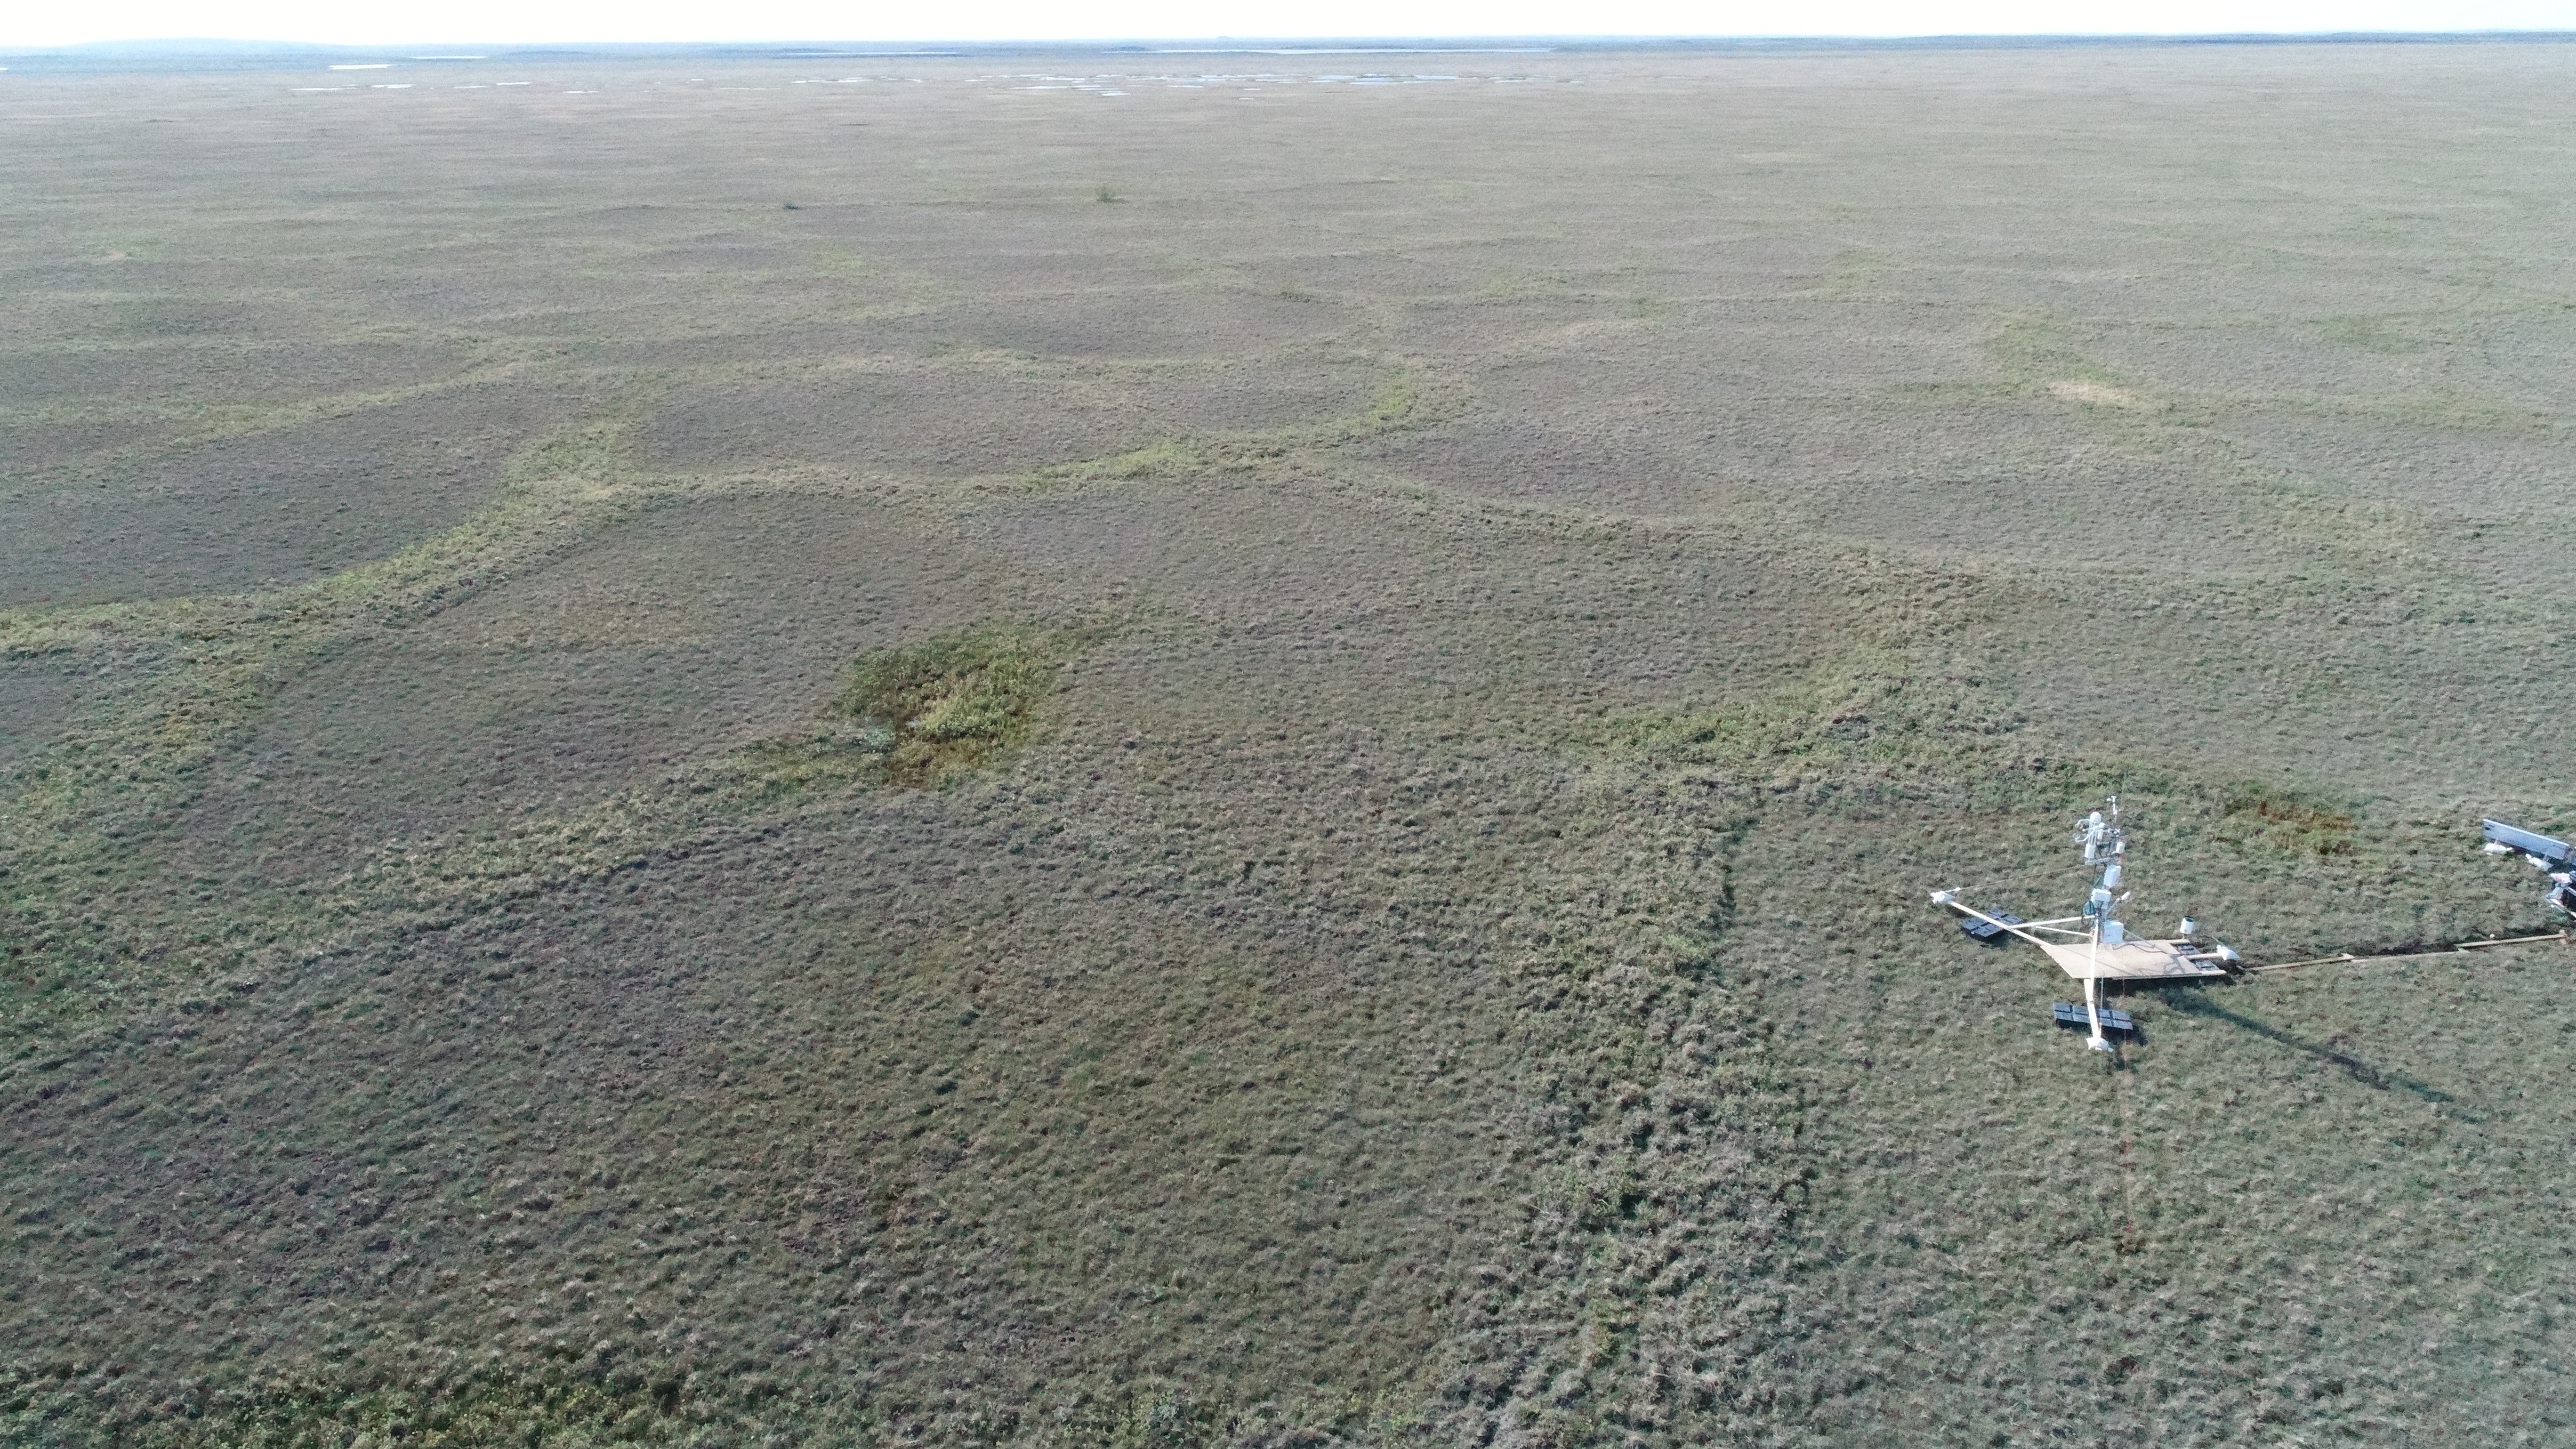
The Eddy Covariance system at Fish Island J. Skeeter (2017)
Maybe insert Web-map showing site instead
Regardless …
How can we use this one year of data from one point location to get a better idea of the Carbon balances in the Arctic? We can pull in data from other sources, do a bit of fancy modelling, and a few “back of the envelope” calculations to come up with some ballpark guesses.
16.4 Data Resolution
What do you do if your data are collected at different resolutions?
16.5 Integrating vector and raster data
How can you work with both raster and vector data and when might you want to switch between data types?
Evey Eddy Covariance observation has a “footprint” or upwind source area for the Carbon. It is calculated using some complicated calculus that is well beyond the scope of this class, but
16.5.1 Rasterization
Say you have a vector layer of landscape classification scheme and need to intersect it with a source area raster
16.5.2 Vectorization
Say you have a model that outputs a raster layer representing an upwind source area for an Eddy Covariance observation and you want to display it in a more human friendly format.
16.5.3 Zonal Statistics
Say you have a raster layer (e.g. maximum annual NDVI) and you want to describe it over a certain region.
16.5.4 Smoothing
16.5.5 Simplifying
16.6 Spatial data errors
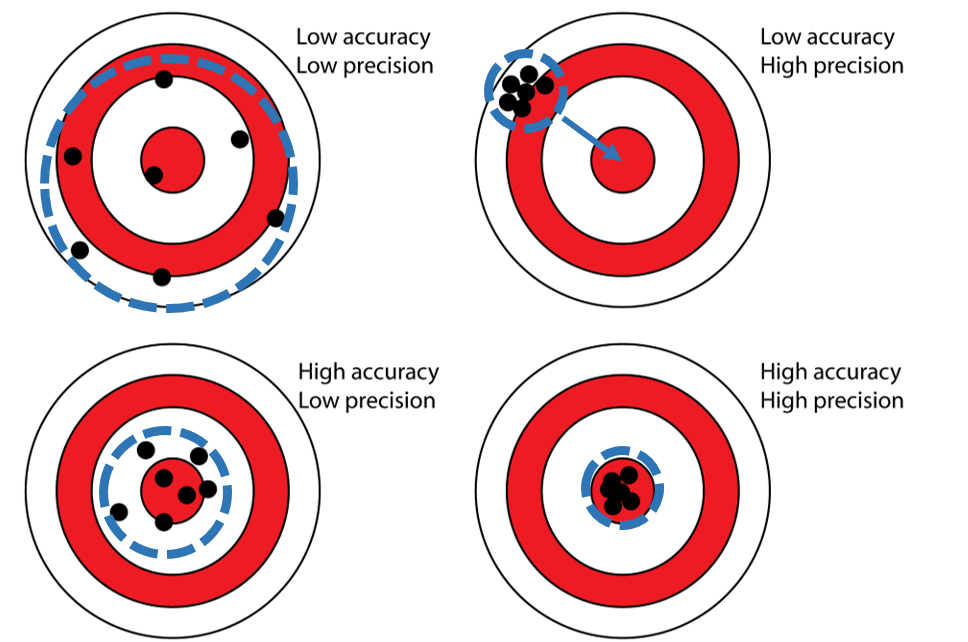
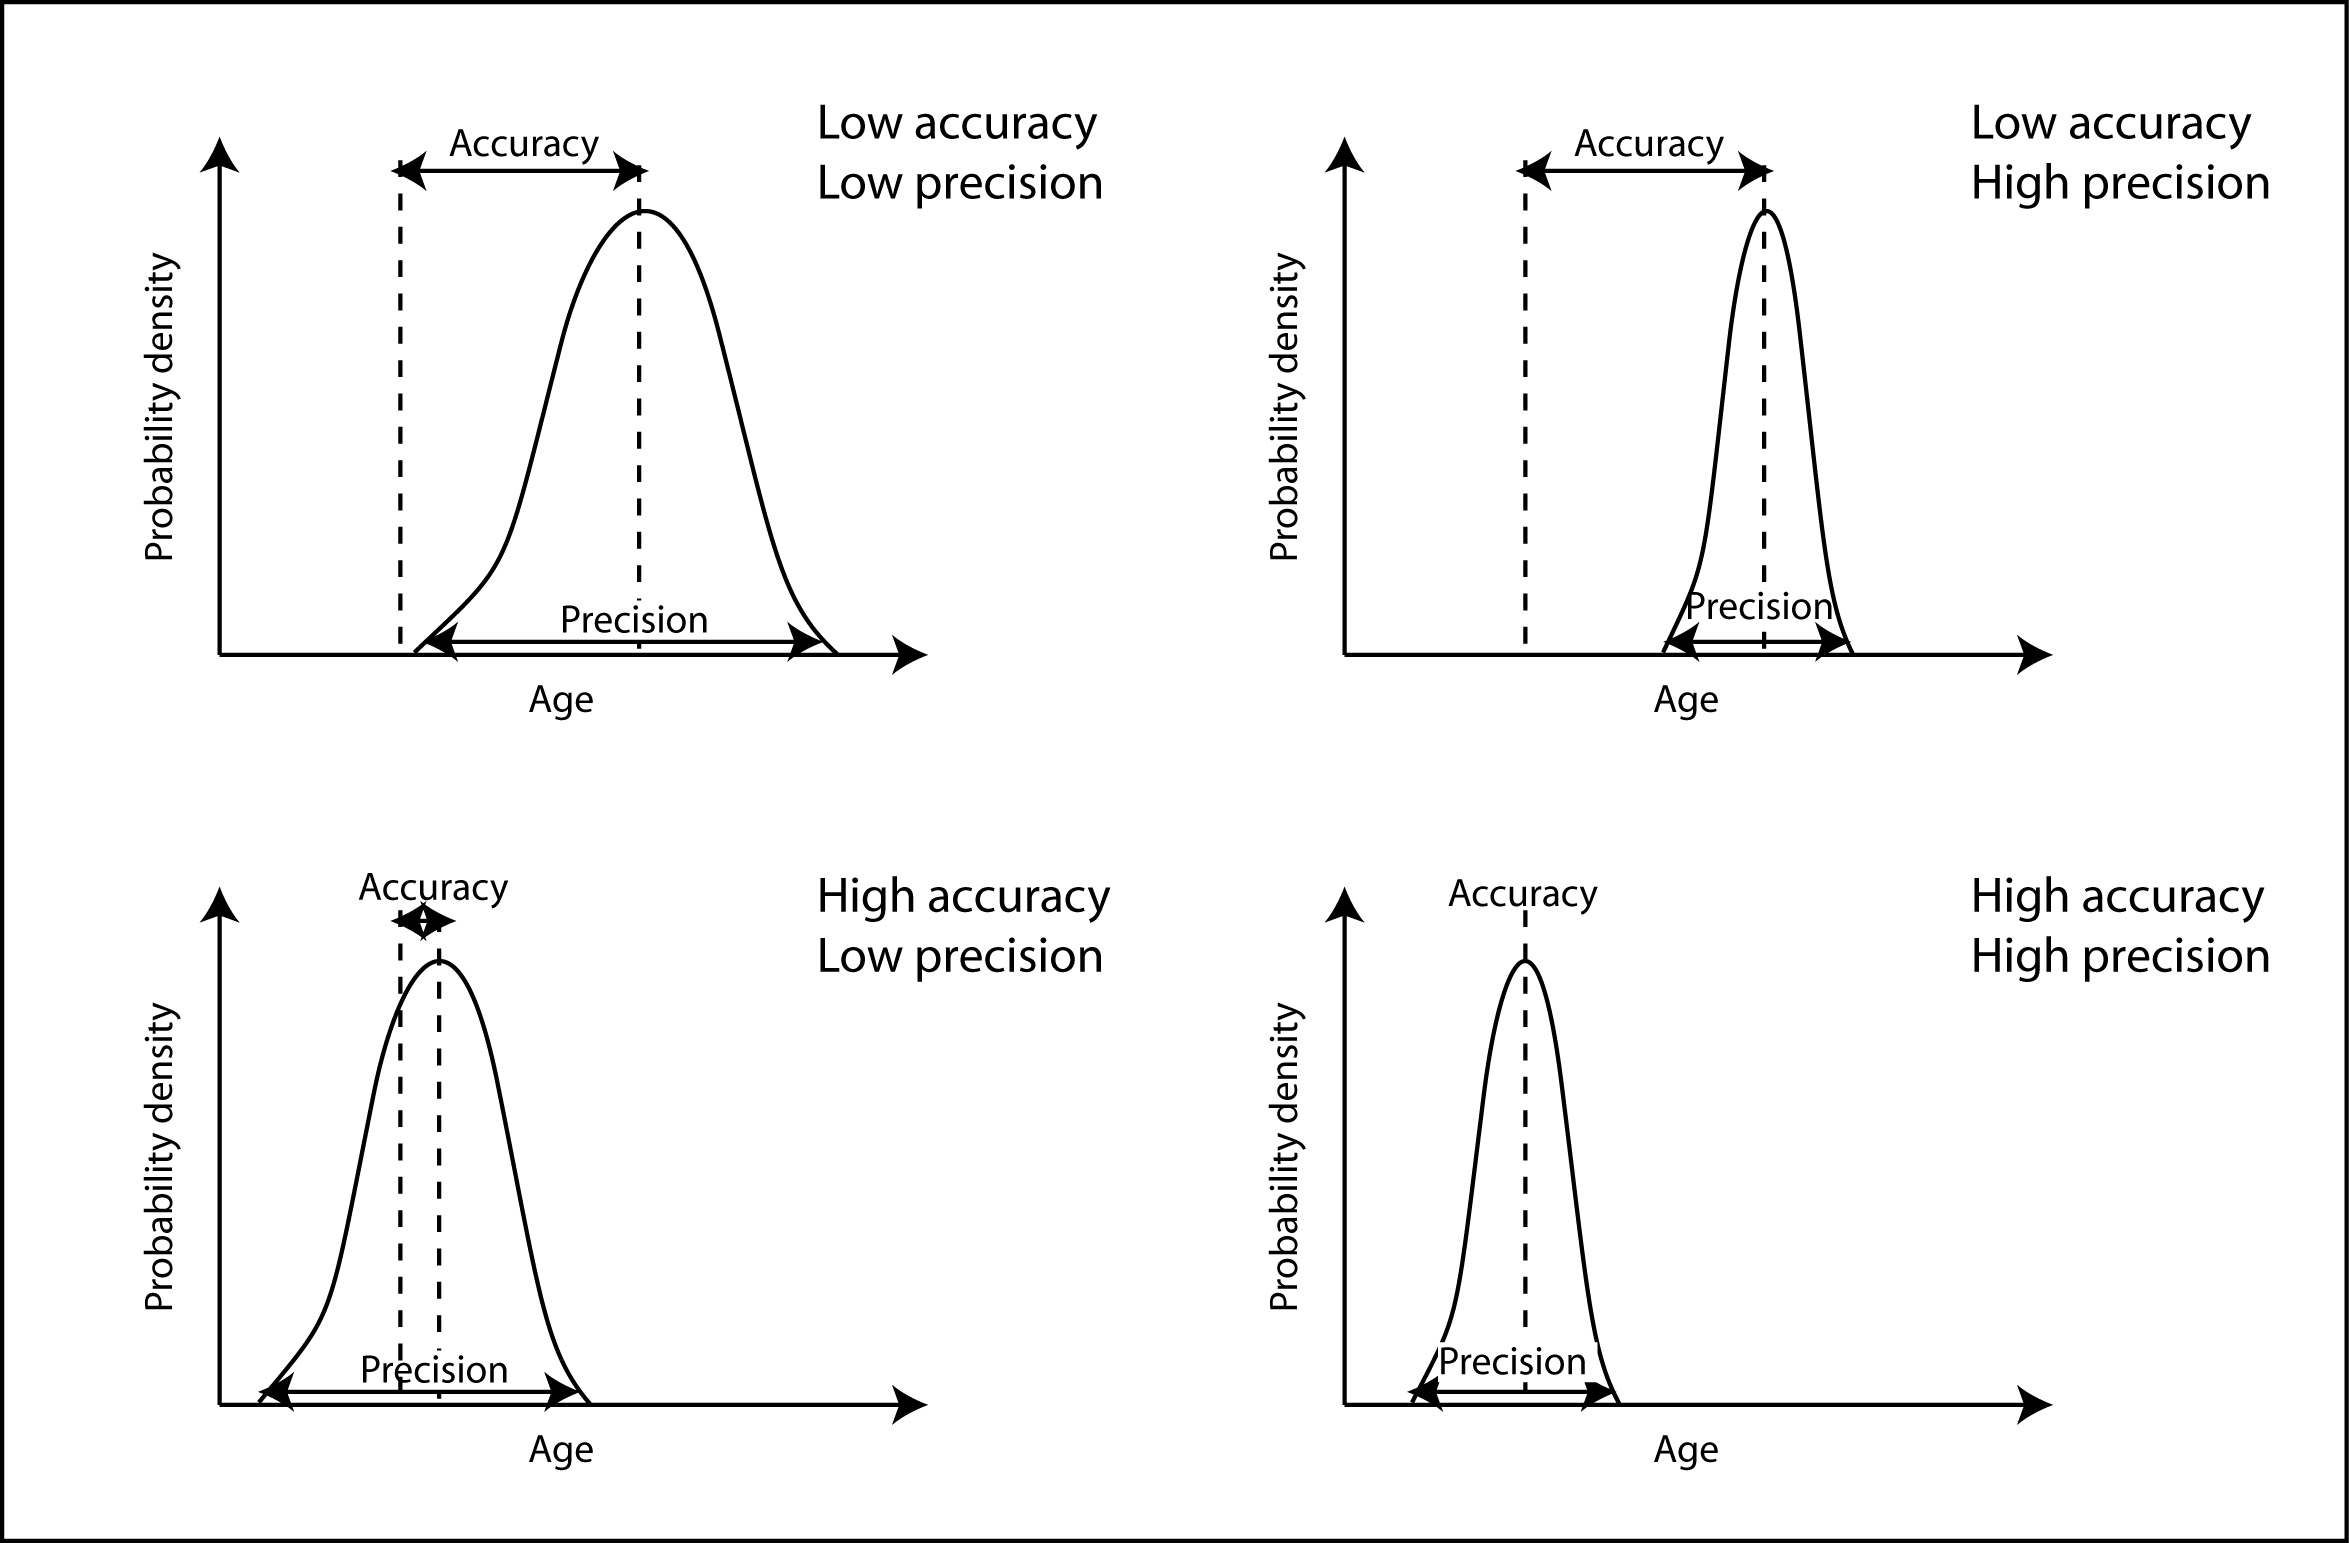
16.6.1 Accuracy vs. Precision
Measurement Errors Accuracy: The degree to which a set of measurements correctly matches the real world values. How close are we to the real value? If there is a consistent (systematic) offset from that real world value, our measurements are inaccurate. They have a bias. Precision: The degree of agreement between multiple measurements of the same real world phenomena. How repeatable is a measurement? If you take five measurements of the same feature, how likely are they to be similar? Lack of precision can be attributed to random errors.
Source
Source
16.6.2 Vagueness and Ambiguity
Vagueness - Victoria … does it mean Victoria BC vs. Victoria AU
Ambiguity - coastline - is it the high water line? Low water line? mean water level?
16.6.3 Quantifying spatial errors RMSE, Euclid’s distance
16.6.4 Logical Errors
Data incongruousness
16.6.5 Ecological Fallacy, Atomistic Fallacy, MAUP etc. Its important to include these, whether here or elsewhere?
16.6.6 Other Errors?
- source data errors, out of date data, data entry & digitization?
::::
Case Study
Large Scale
Footprint mapping, temporal upscaling. I’ll fill in more text here later, these figs are just grabbed from my thesis chapters. The gist of it - Measured NEE in one year. Have 10 years of climate data + Reanalysis data + satellite data. Combine these data sources & train a model to do a temporal upscale/sensitivity analysis to see how inter-annual climate variability impacts NEE. Then do a landscape classification with a greenest pixel NDVI image, intersecting with the flux footprint. Use that to find the representative areas to do a “back of the envelope” spatial upscaling.
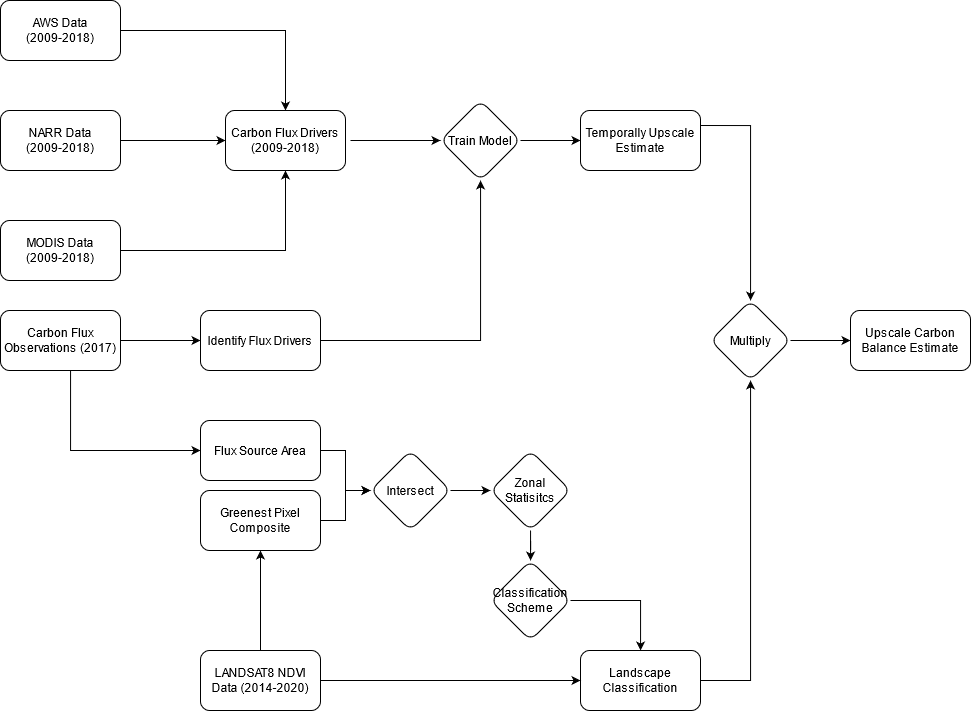
Rough flowchart draft
Reference map showing the Mackenzie Delta (Currently from chapter 2, I’ll change it to a full delta NDVI map)
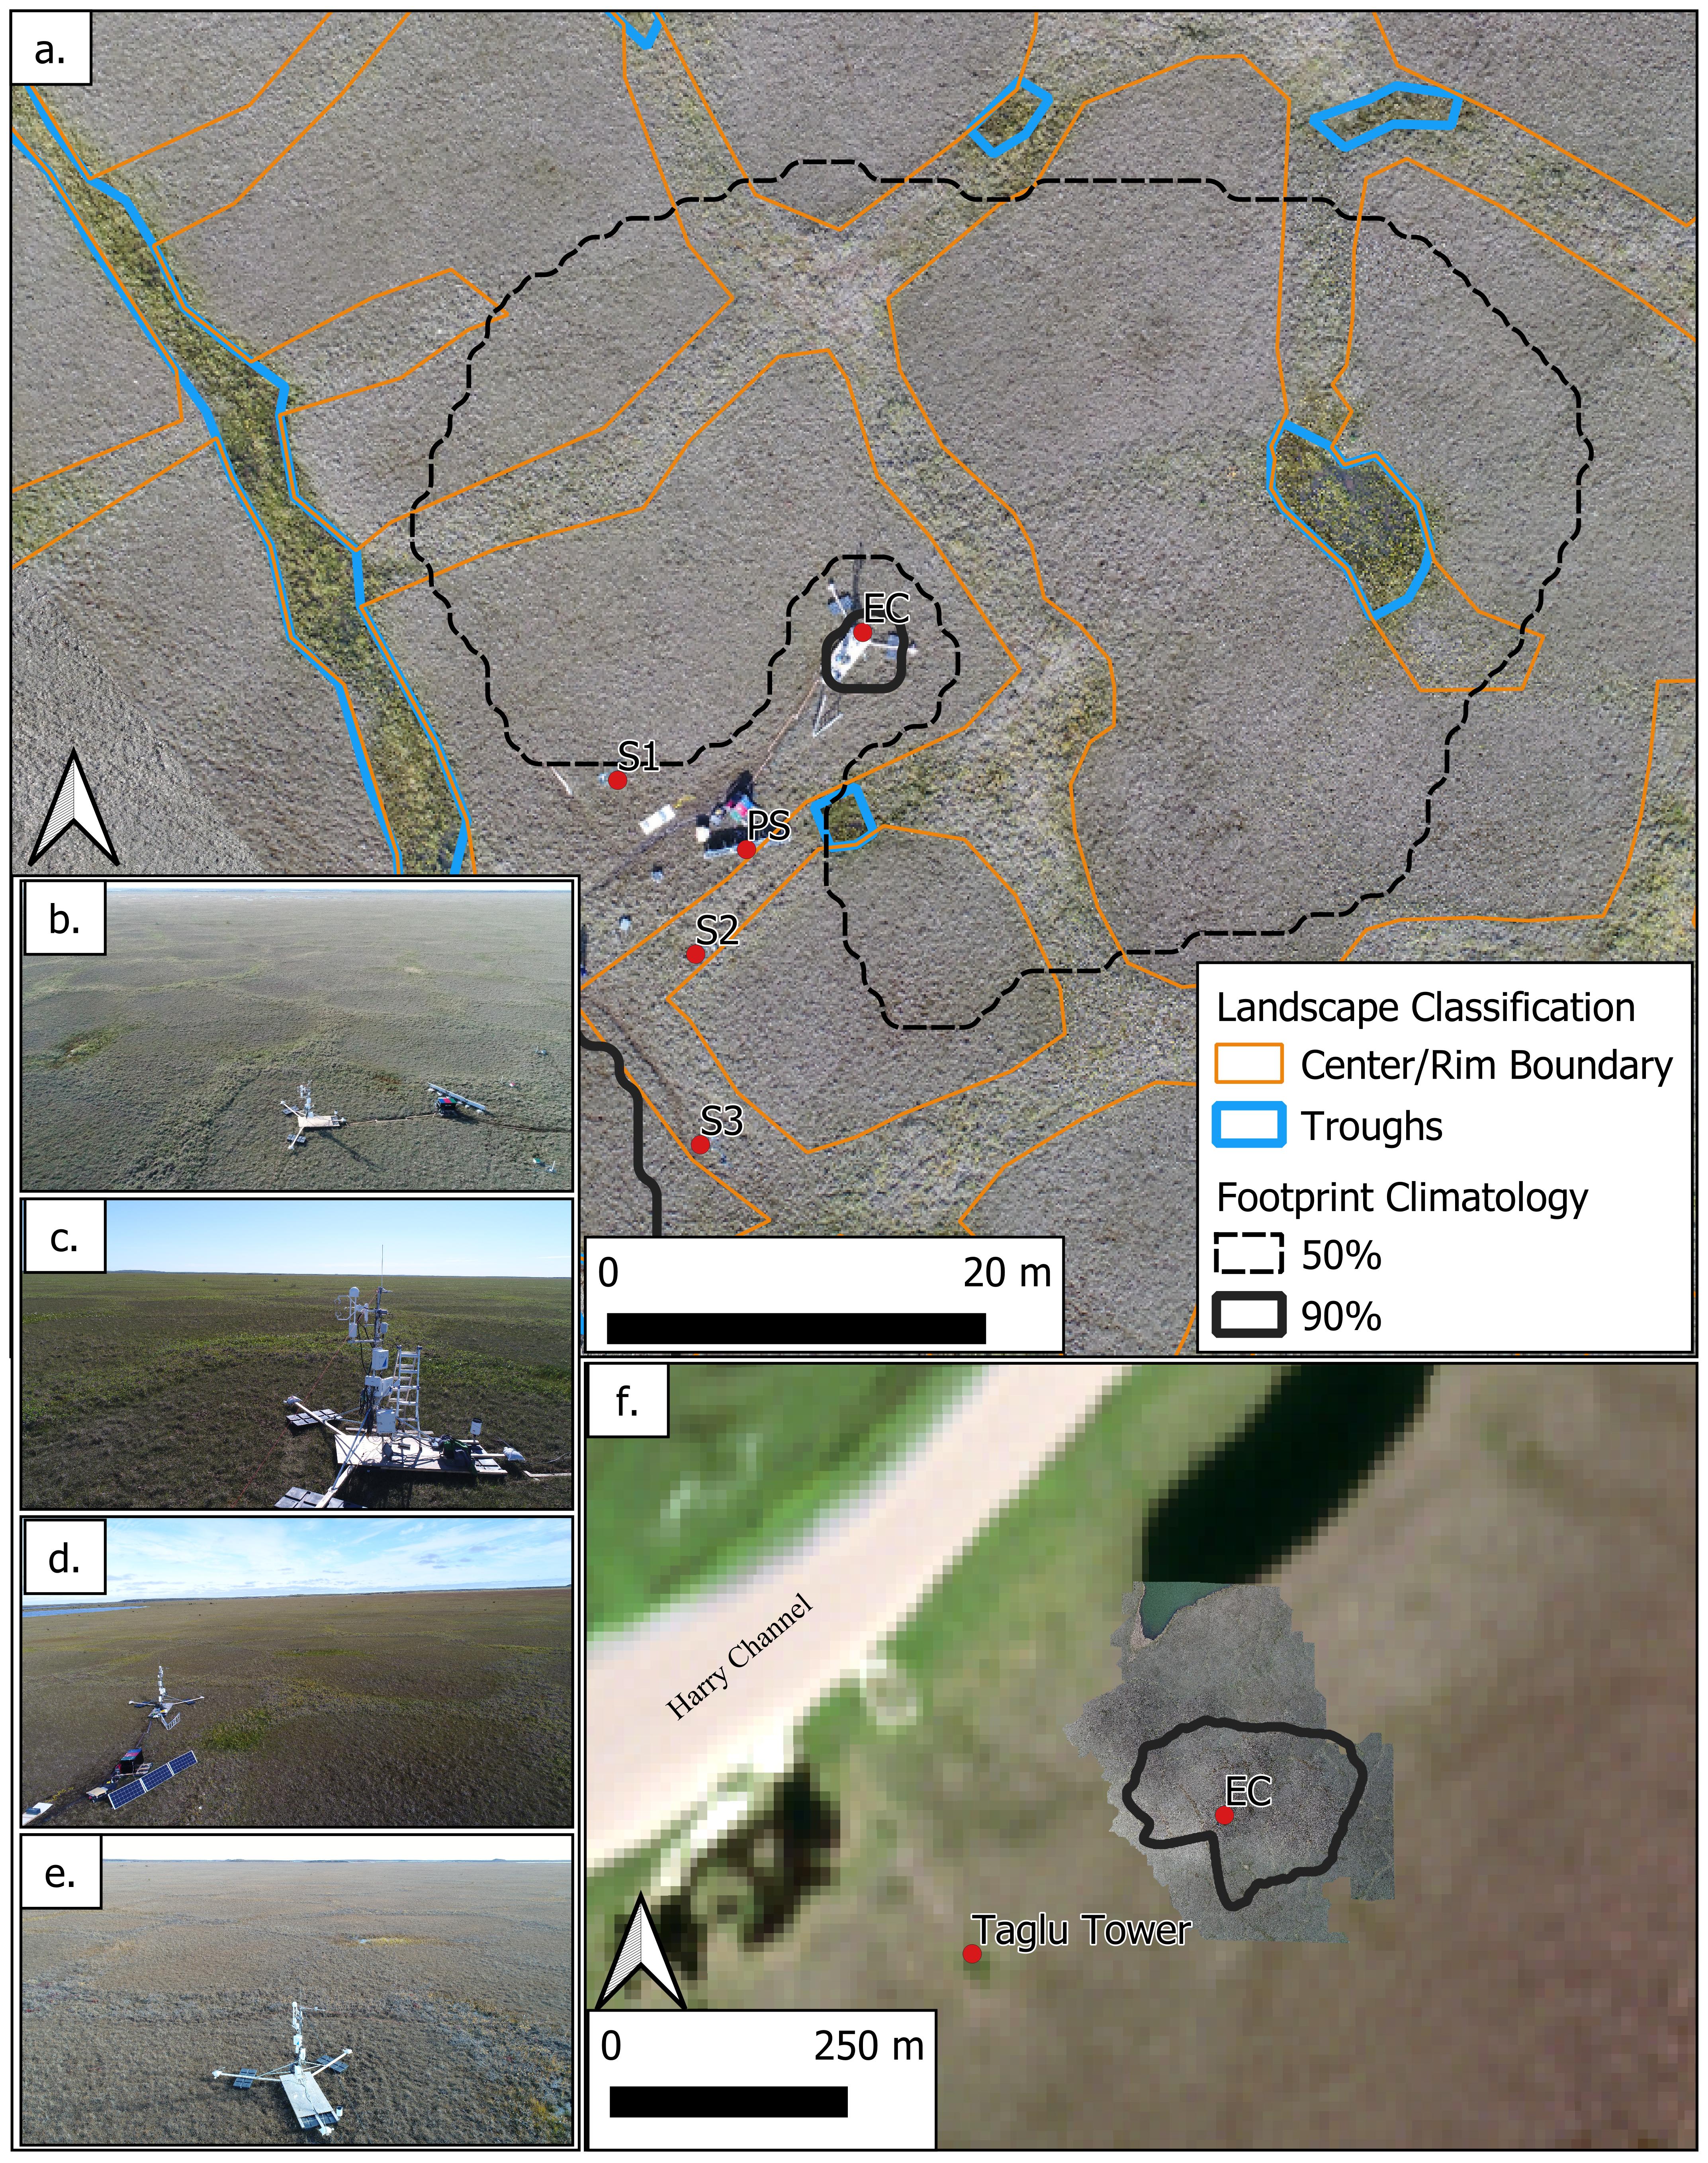
Landscape classification and drone imagery
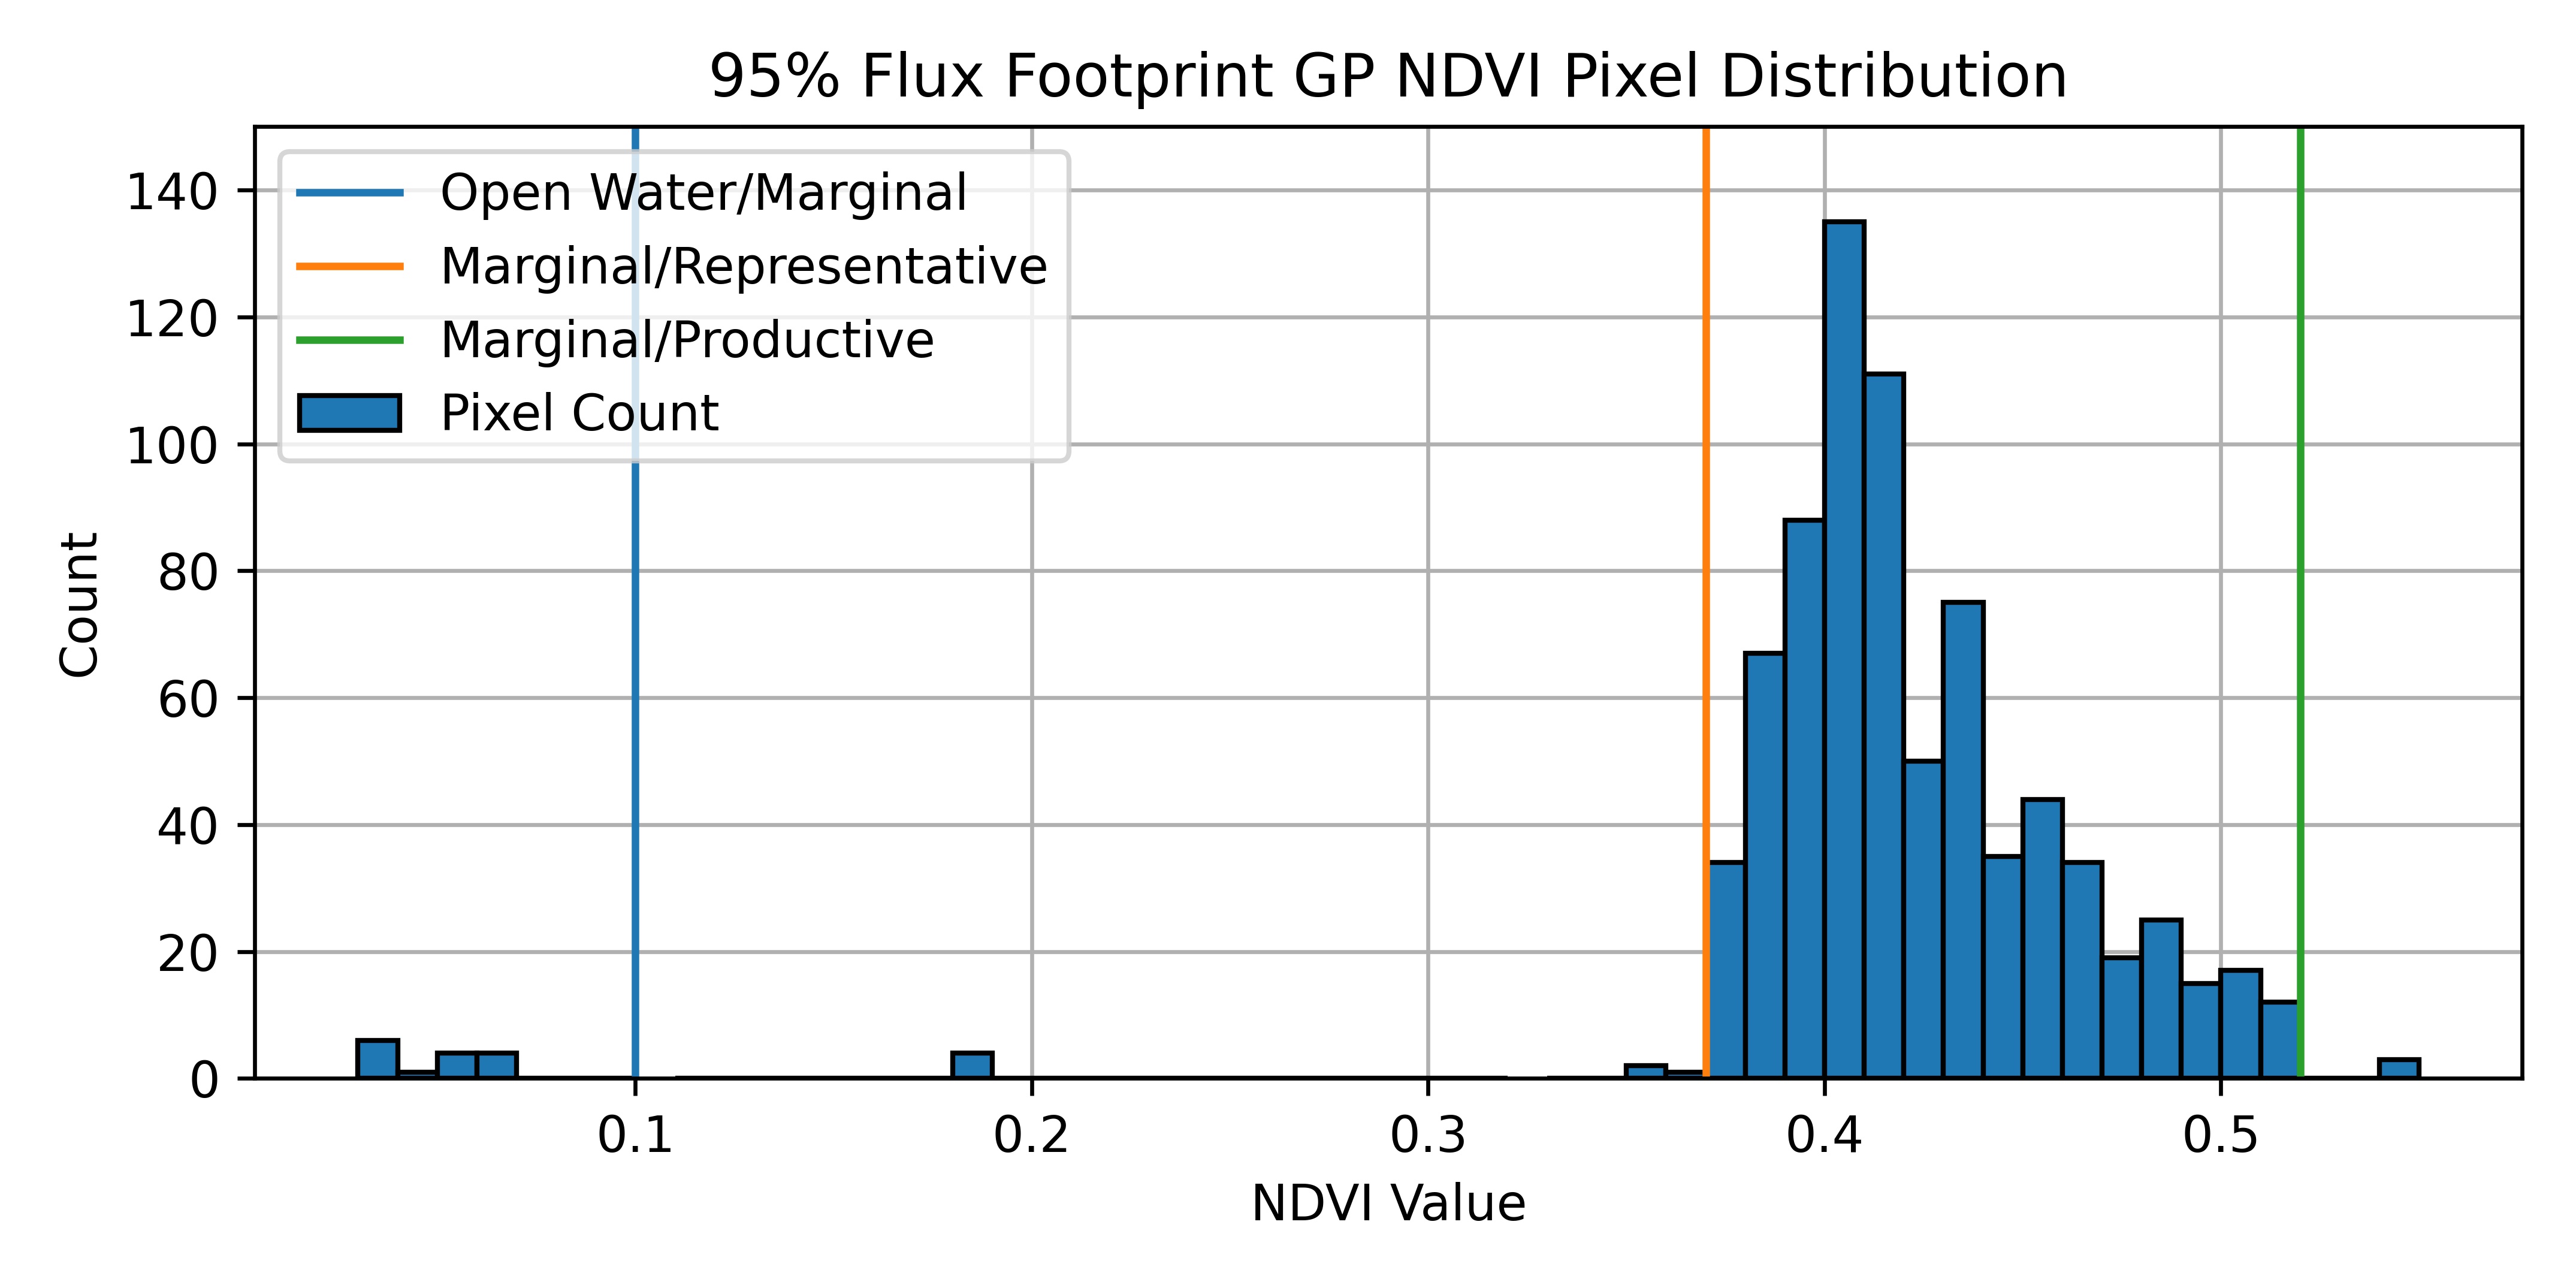
Footprint NDVI profile

Climate Data

Temporally upscaled flux estimate
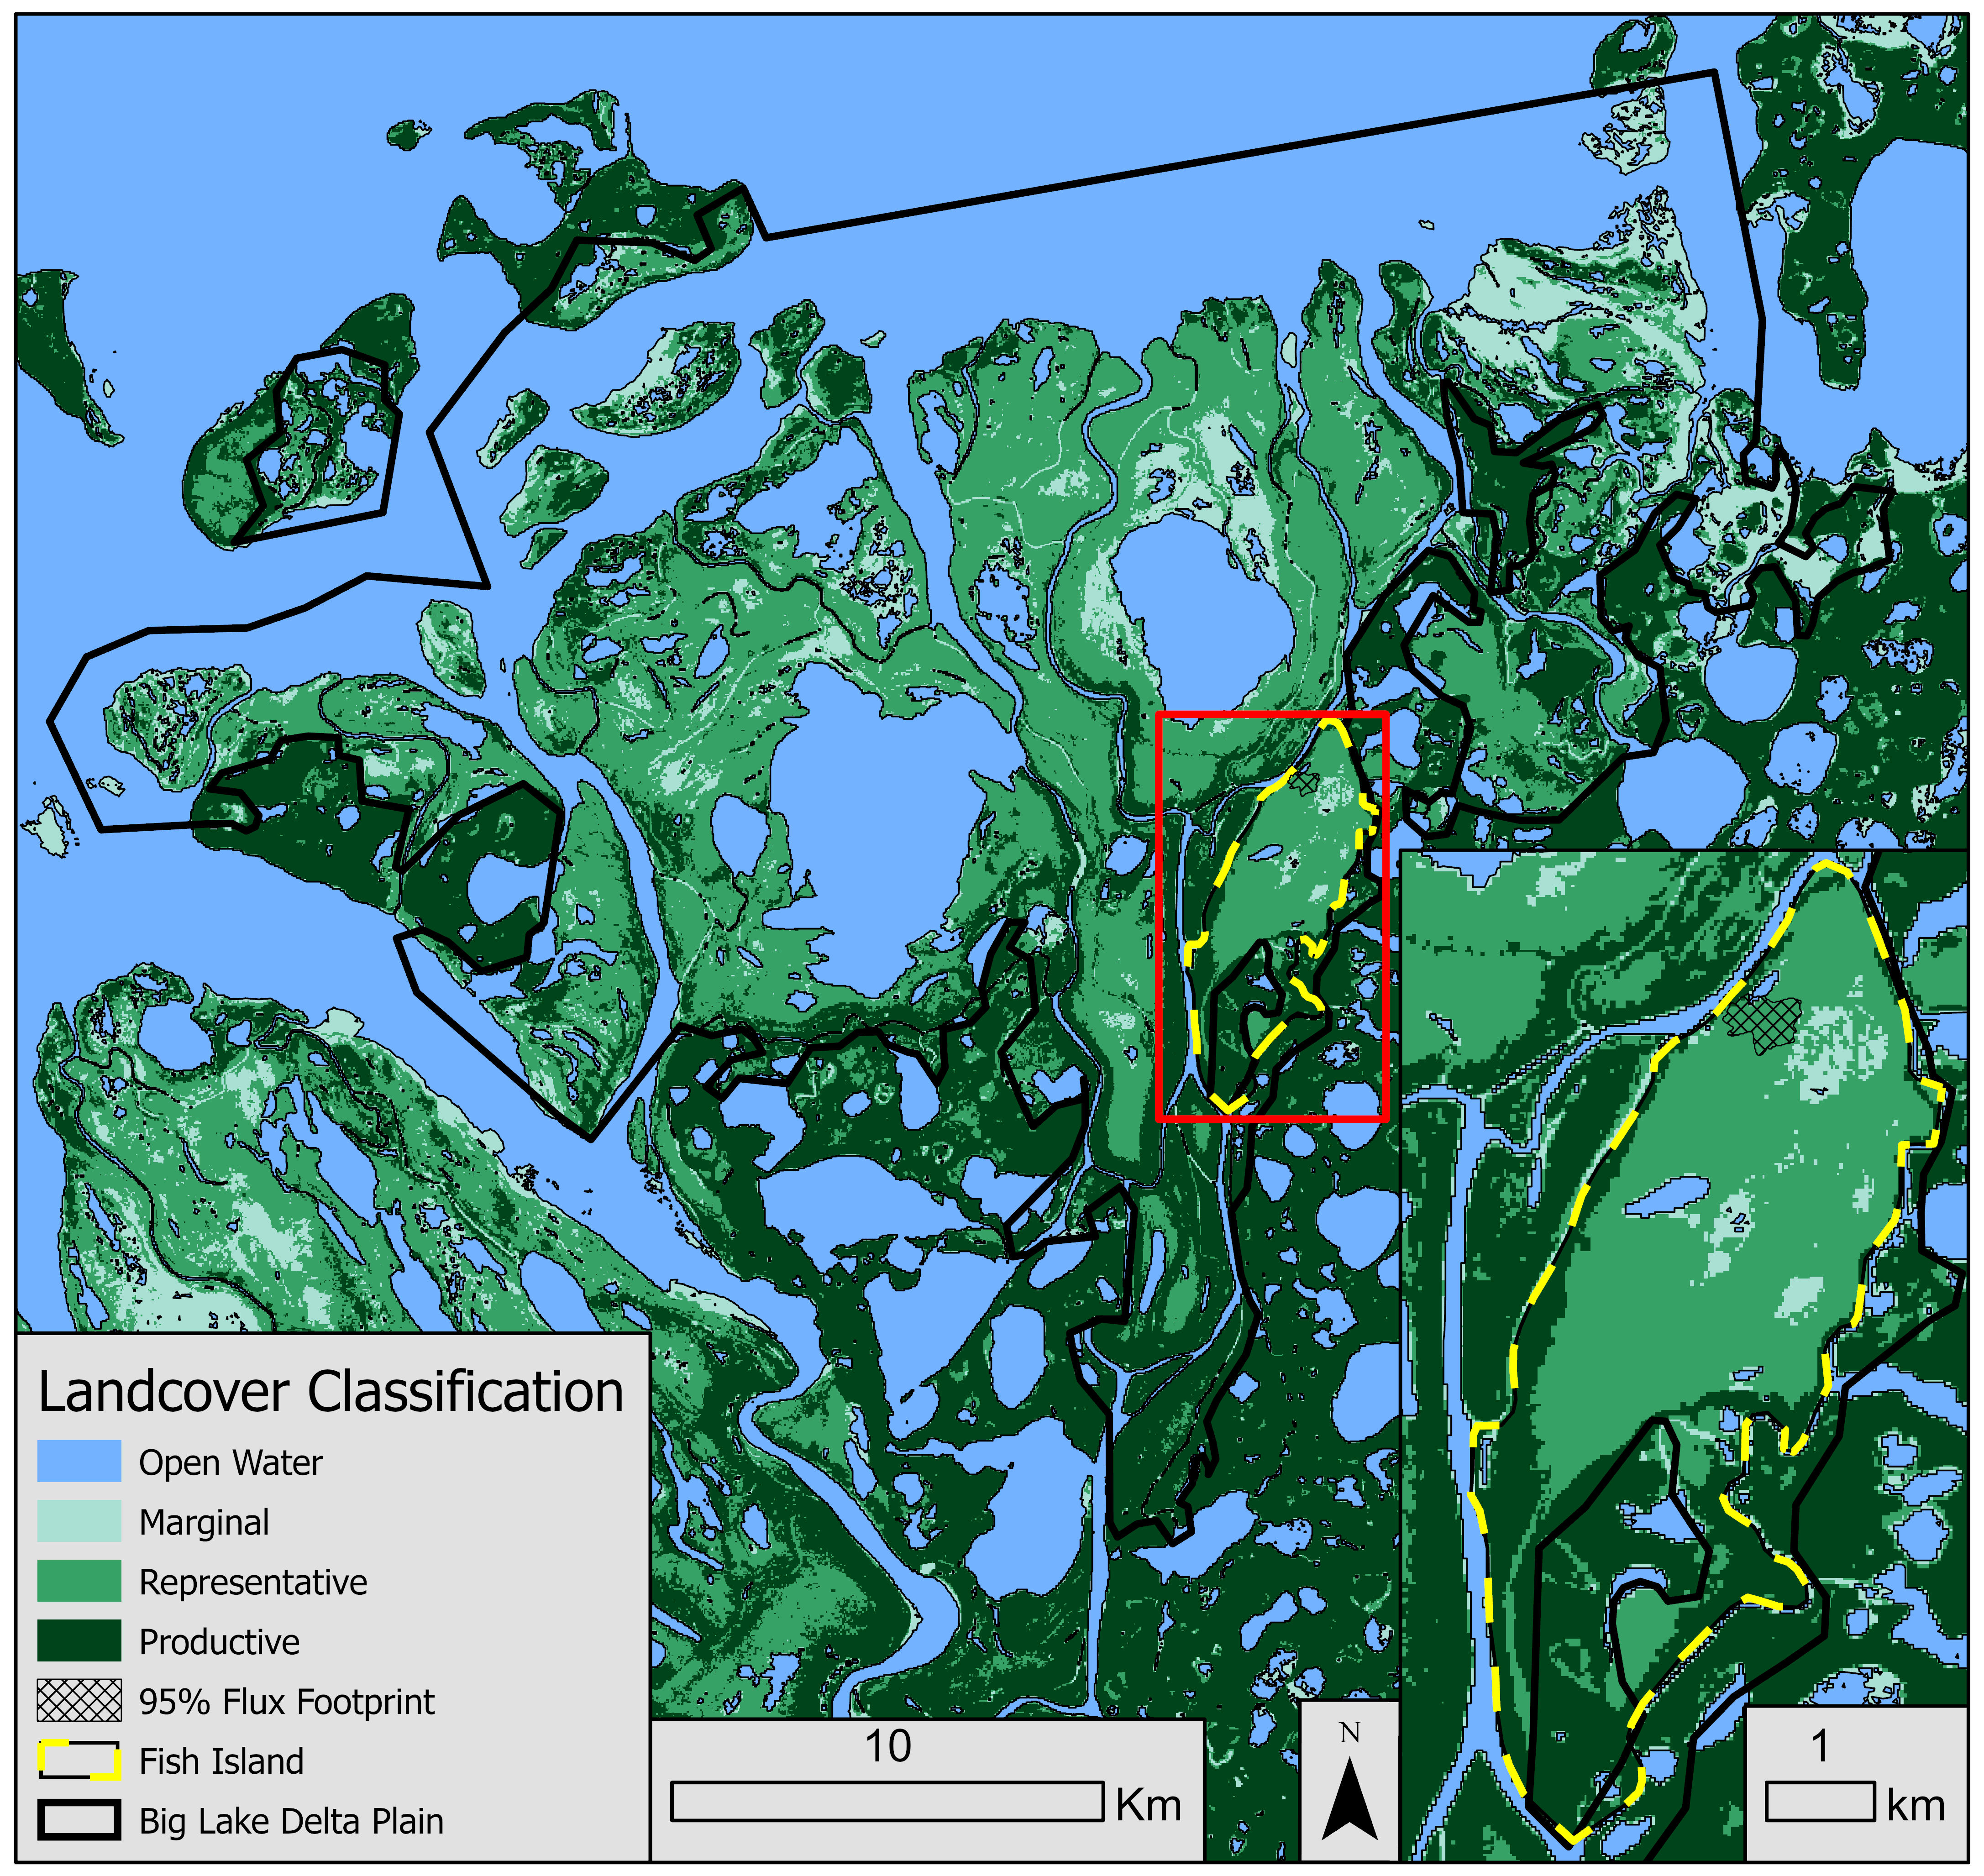
Landscape classification based on fig 3
::::
Case Study
Small Scale
Case Study: UBC Trees in a Changing Climate
The file structure for this case study doesn’t match the structure of the template, so I’ve left it out for now, until I can get a bit more guidance on it.