Recent Work
Here is a sampling of some of the things I’ve been working on.
Research & Field Work
Presently, I am primarily focused on developing a network of eddy covariance (EC) stations in the Mackenzie Delta region of the Northwest Territories. Some of my previous projects are listed below.
Eddy Pro Automation
I have developed an API for automating Eddy Pro, a widely used application for processing eddy covariance data. The application is still undergoing revisions, but you can find the most recent updates here.
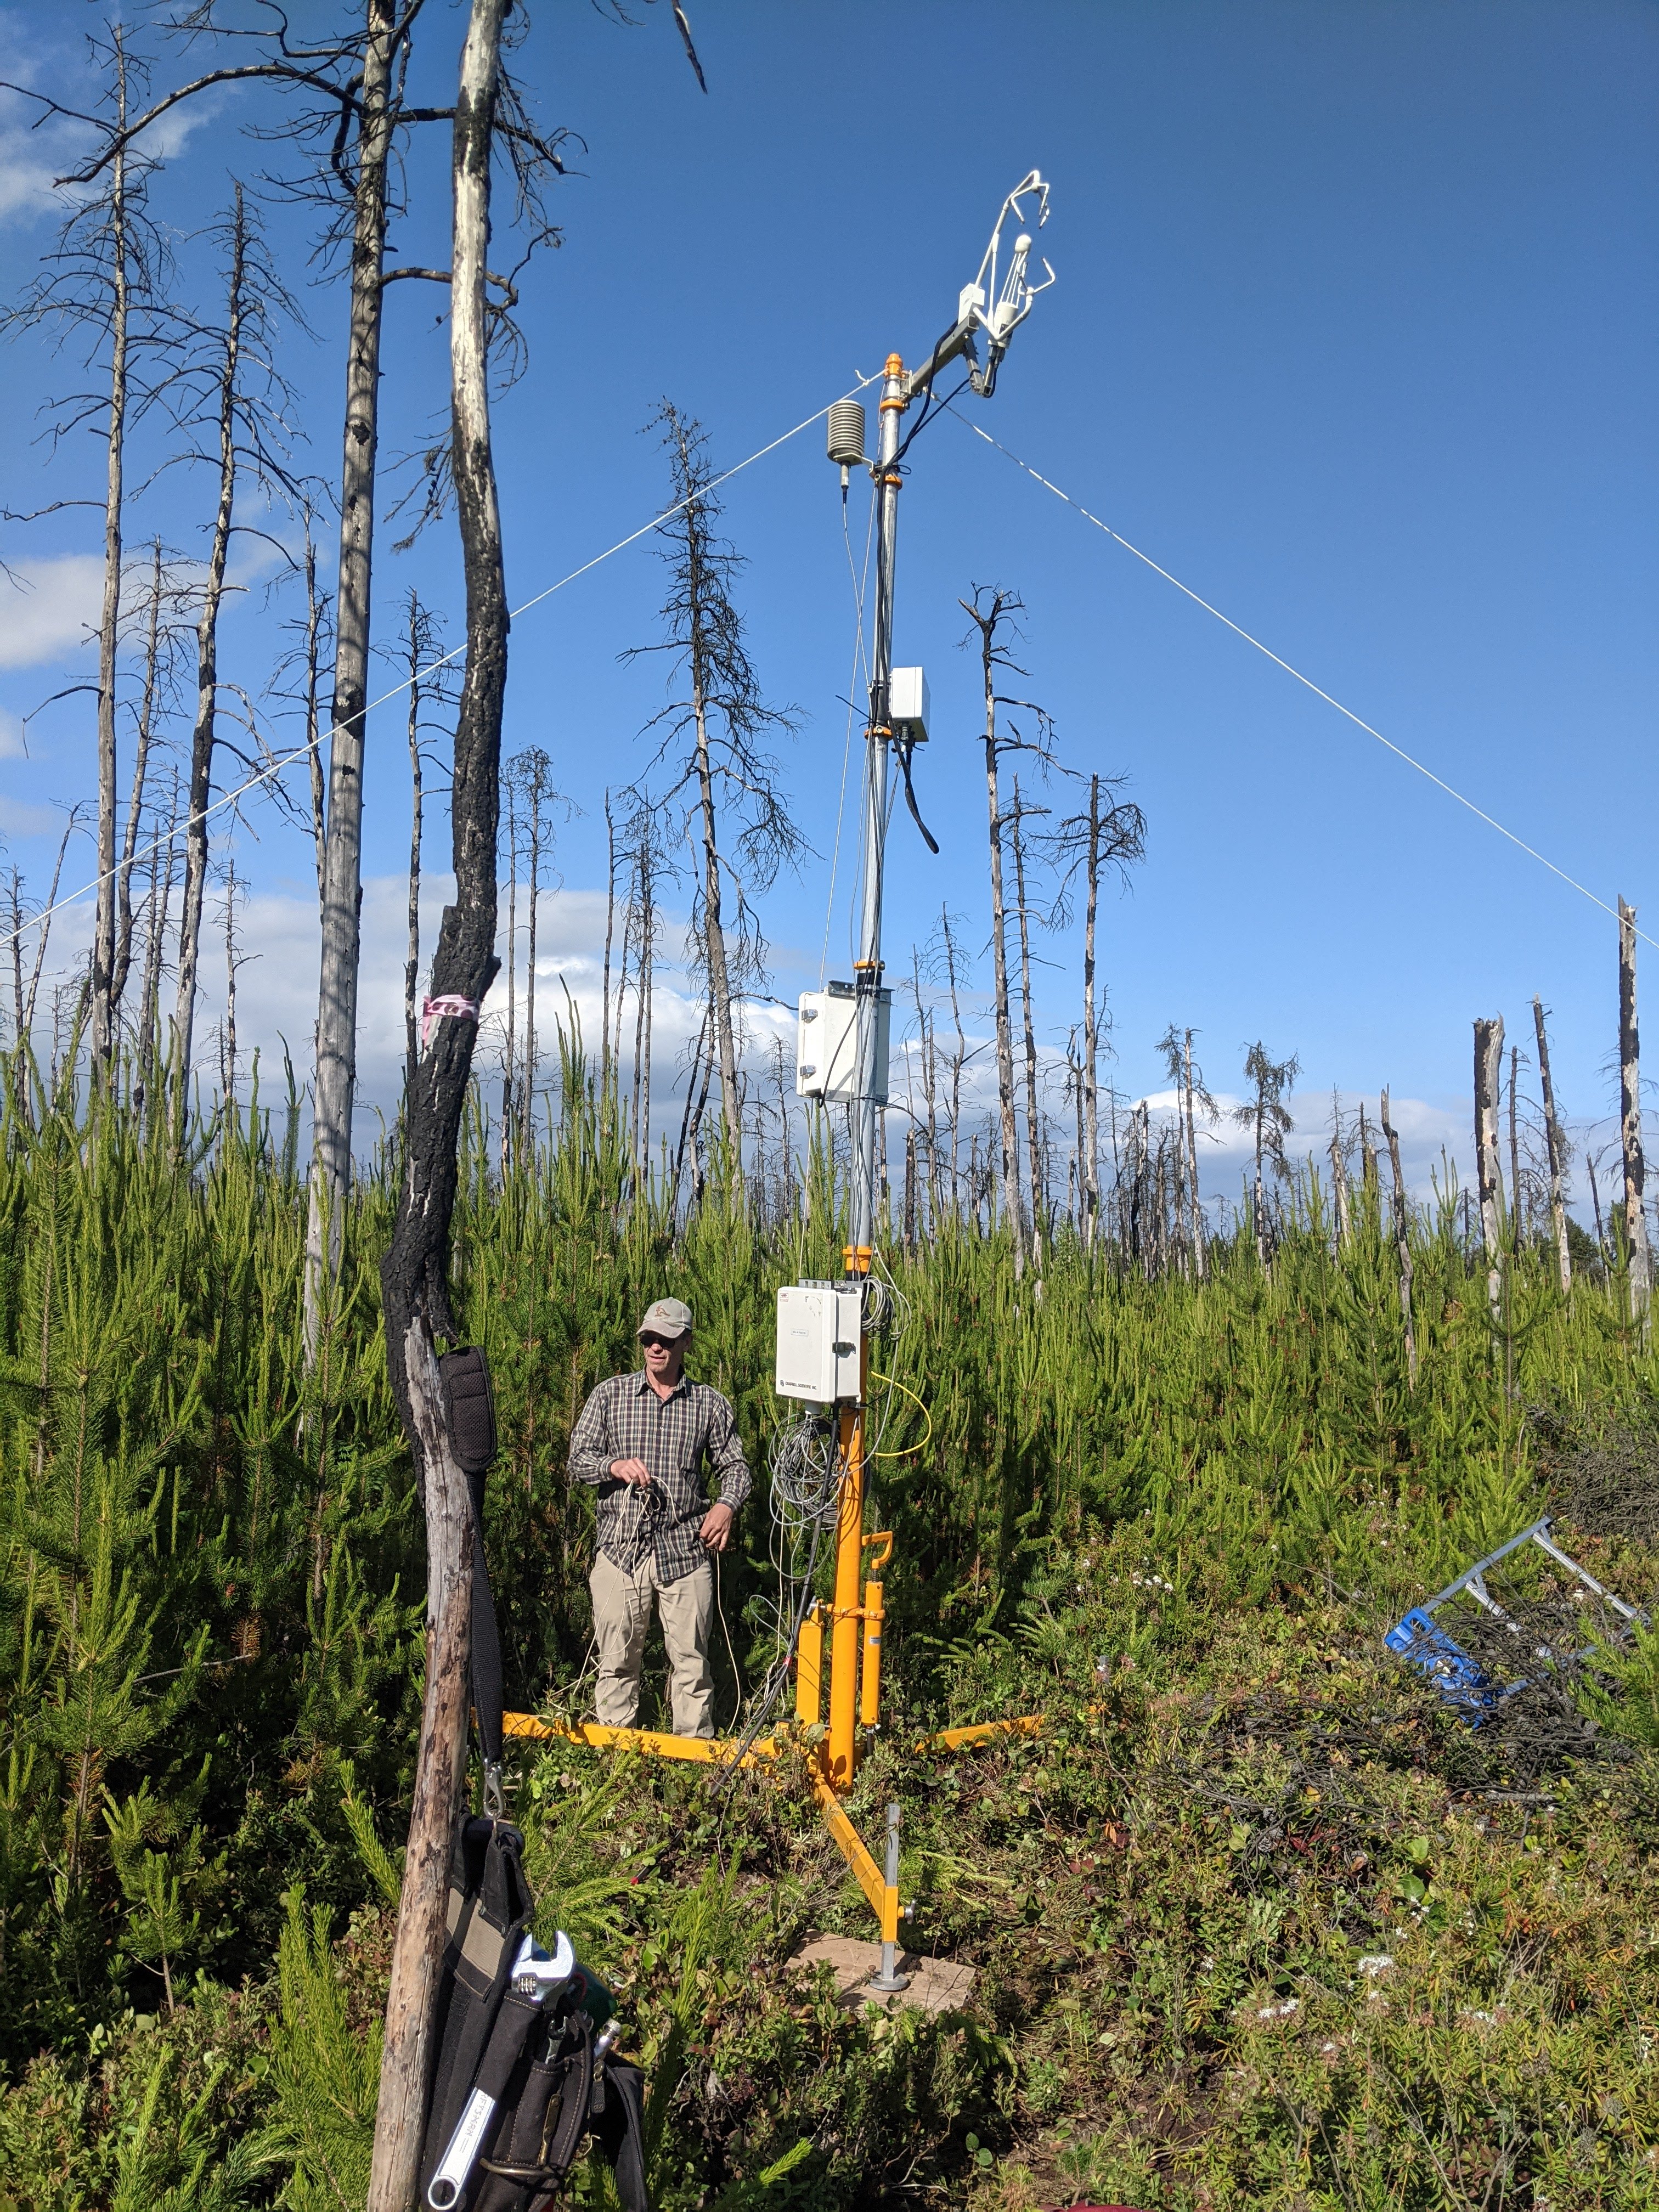
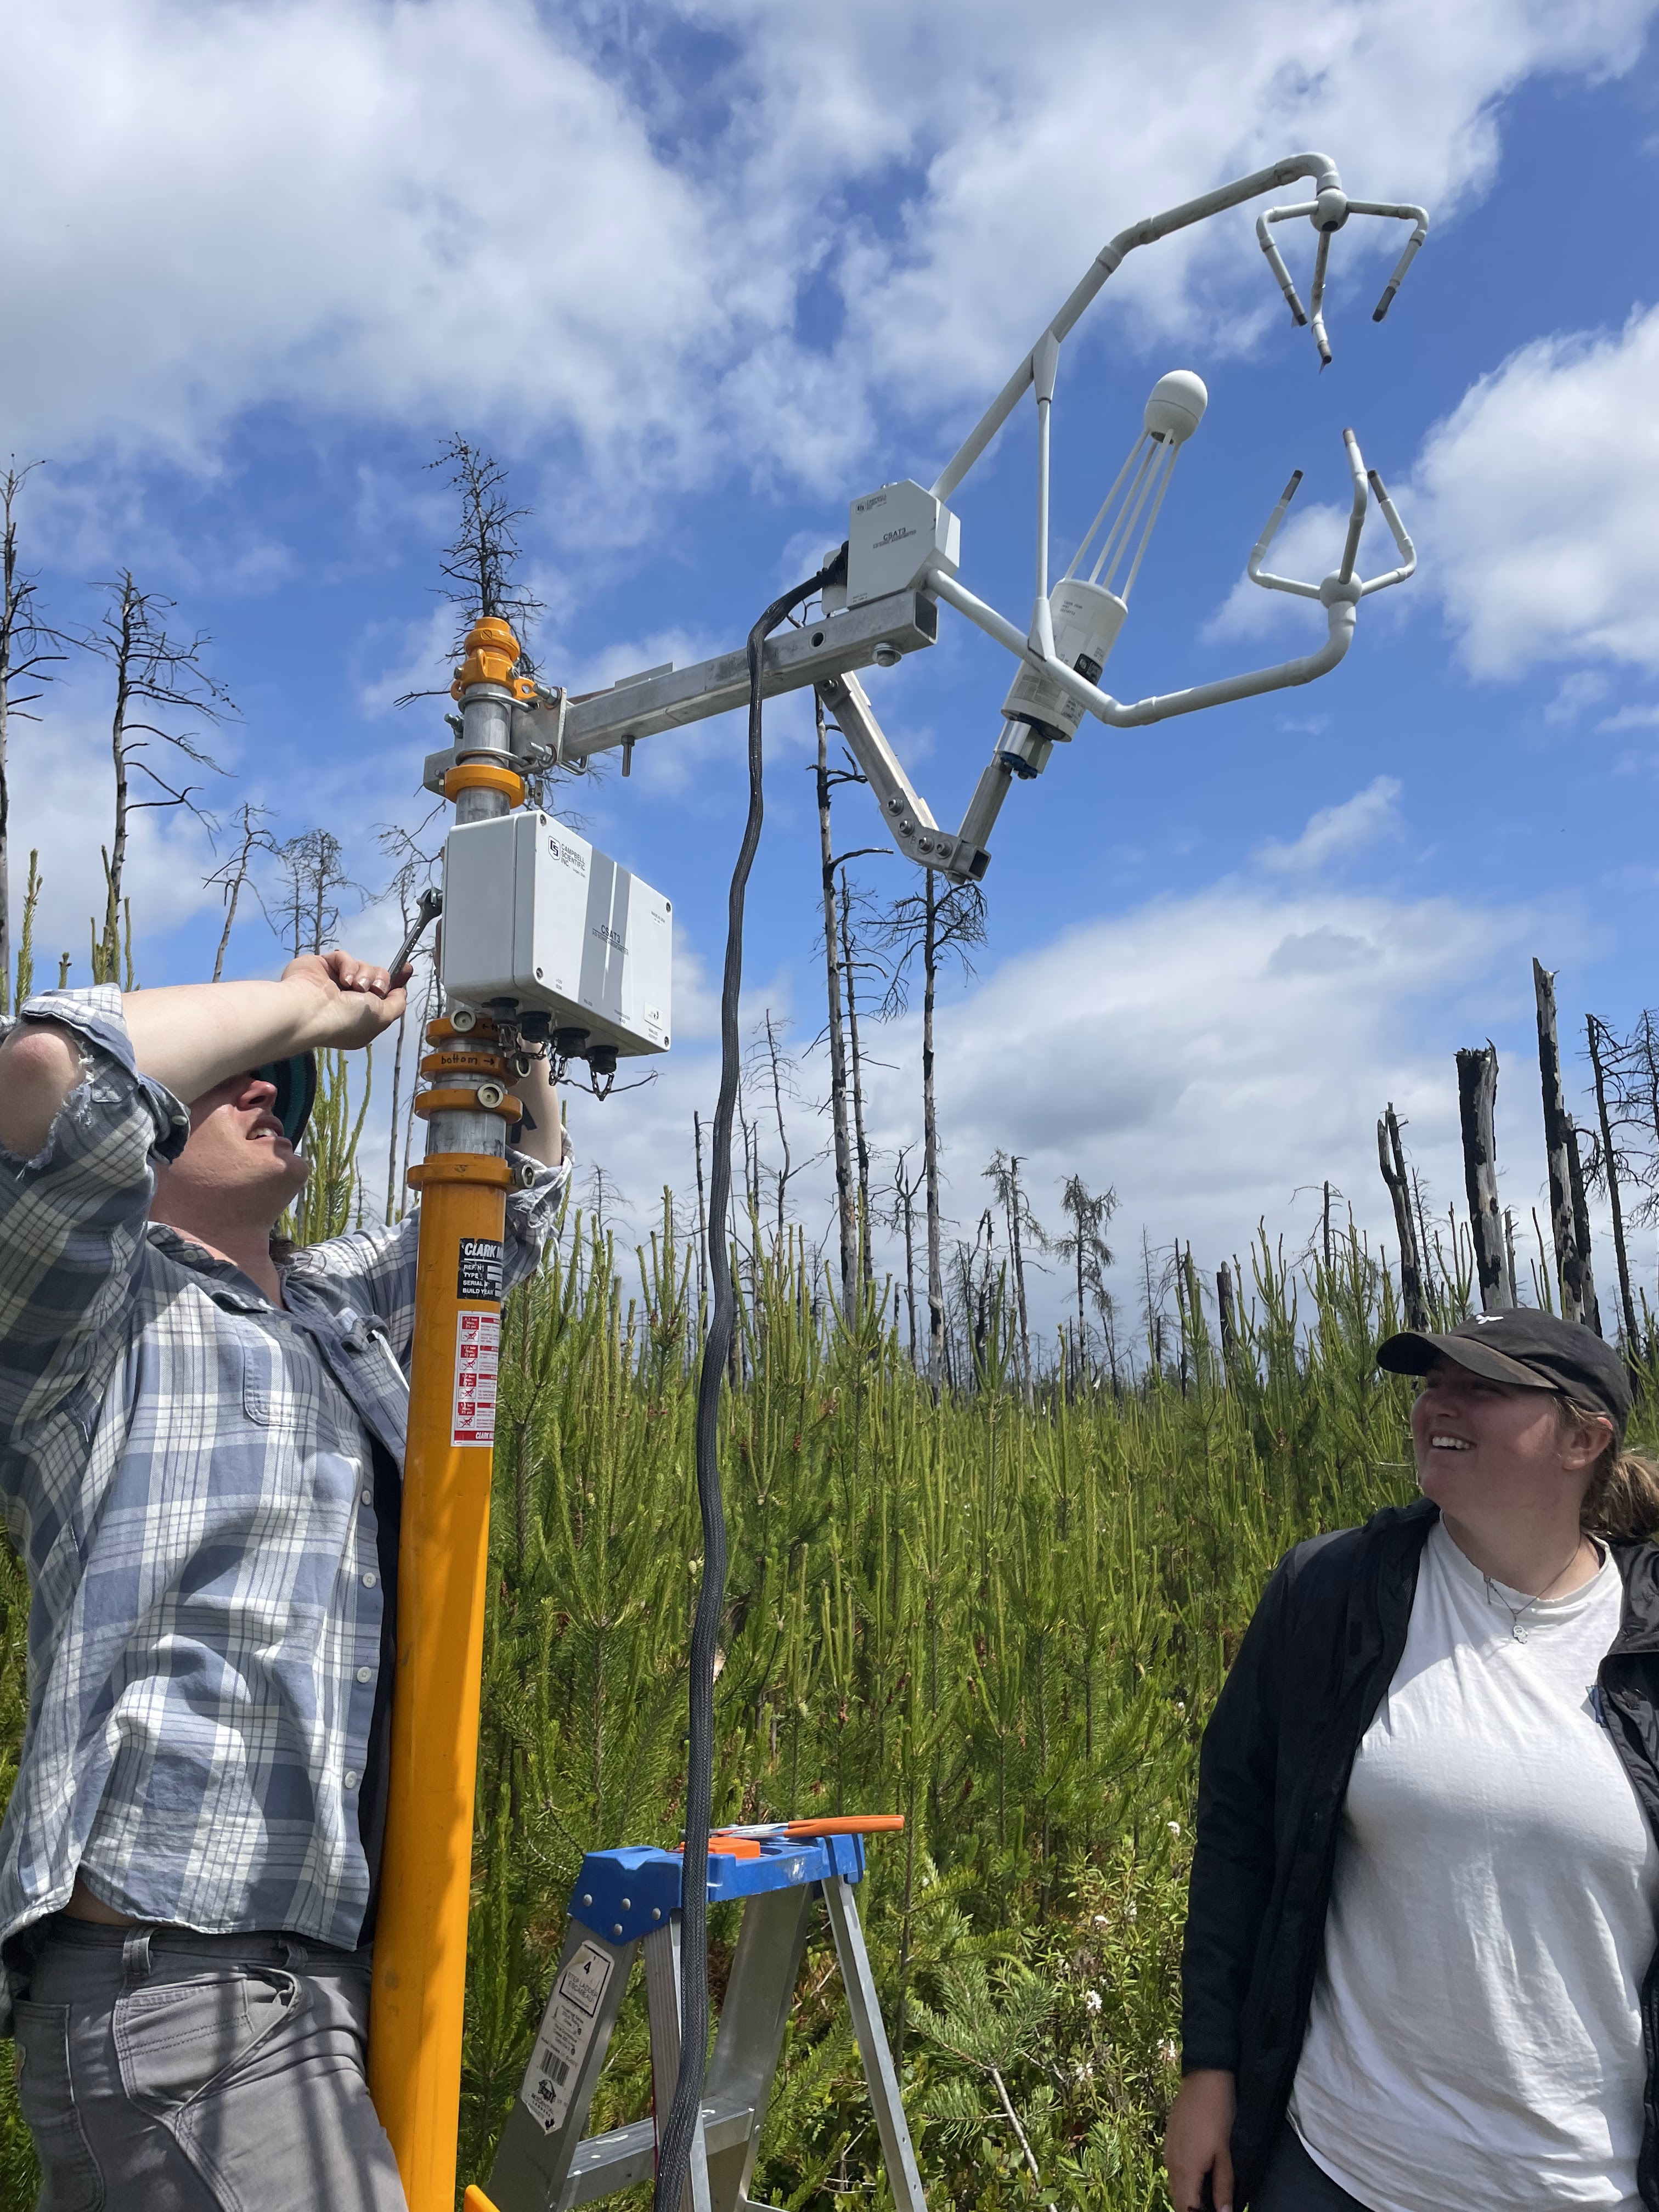
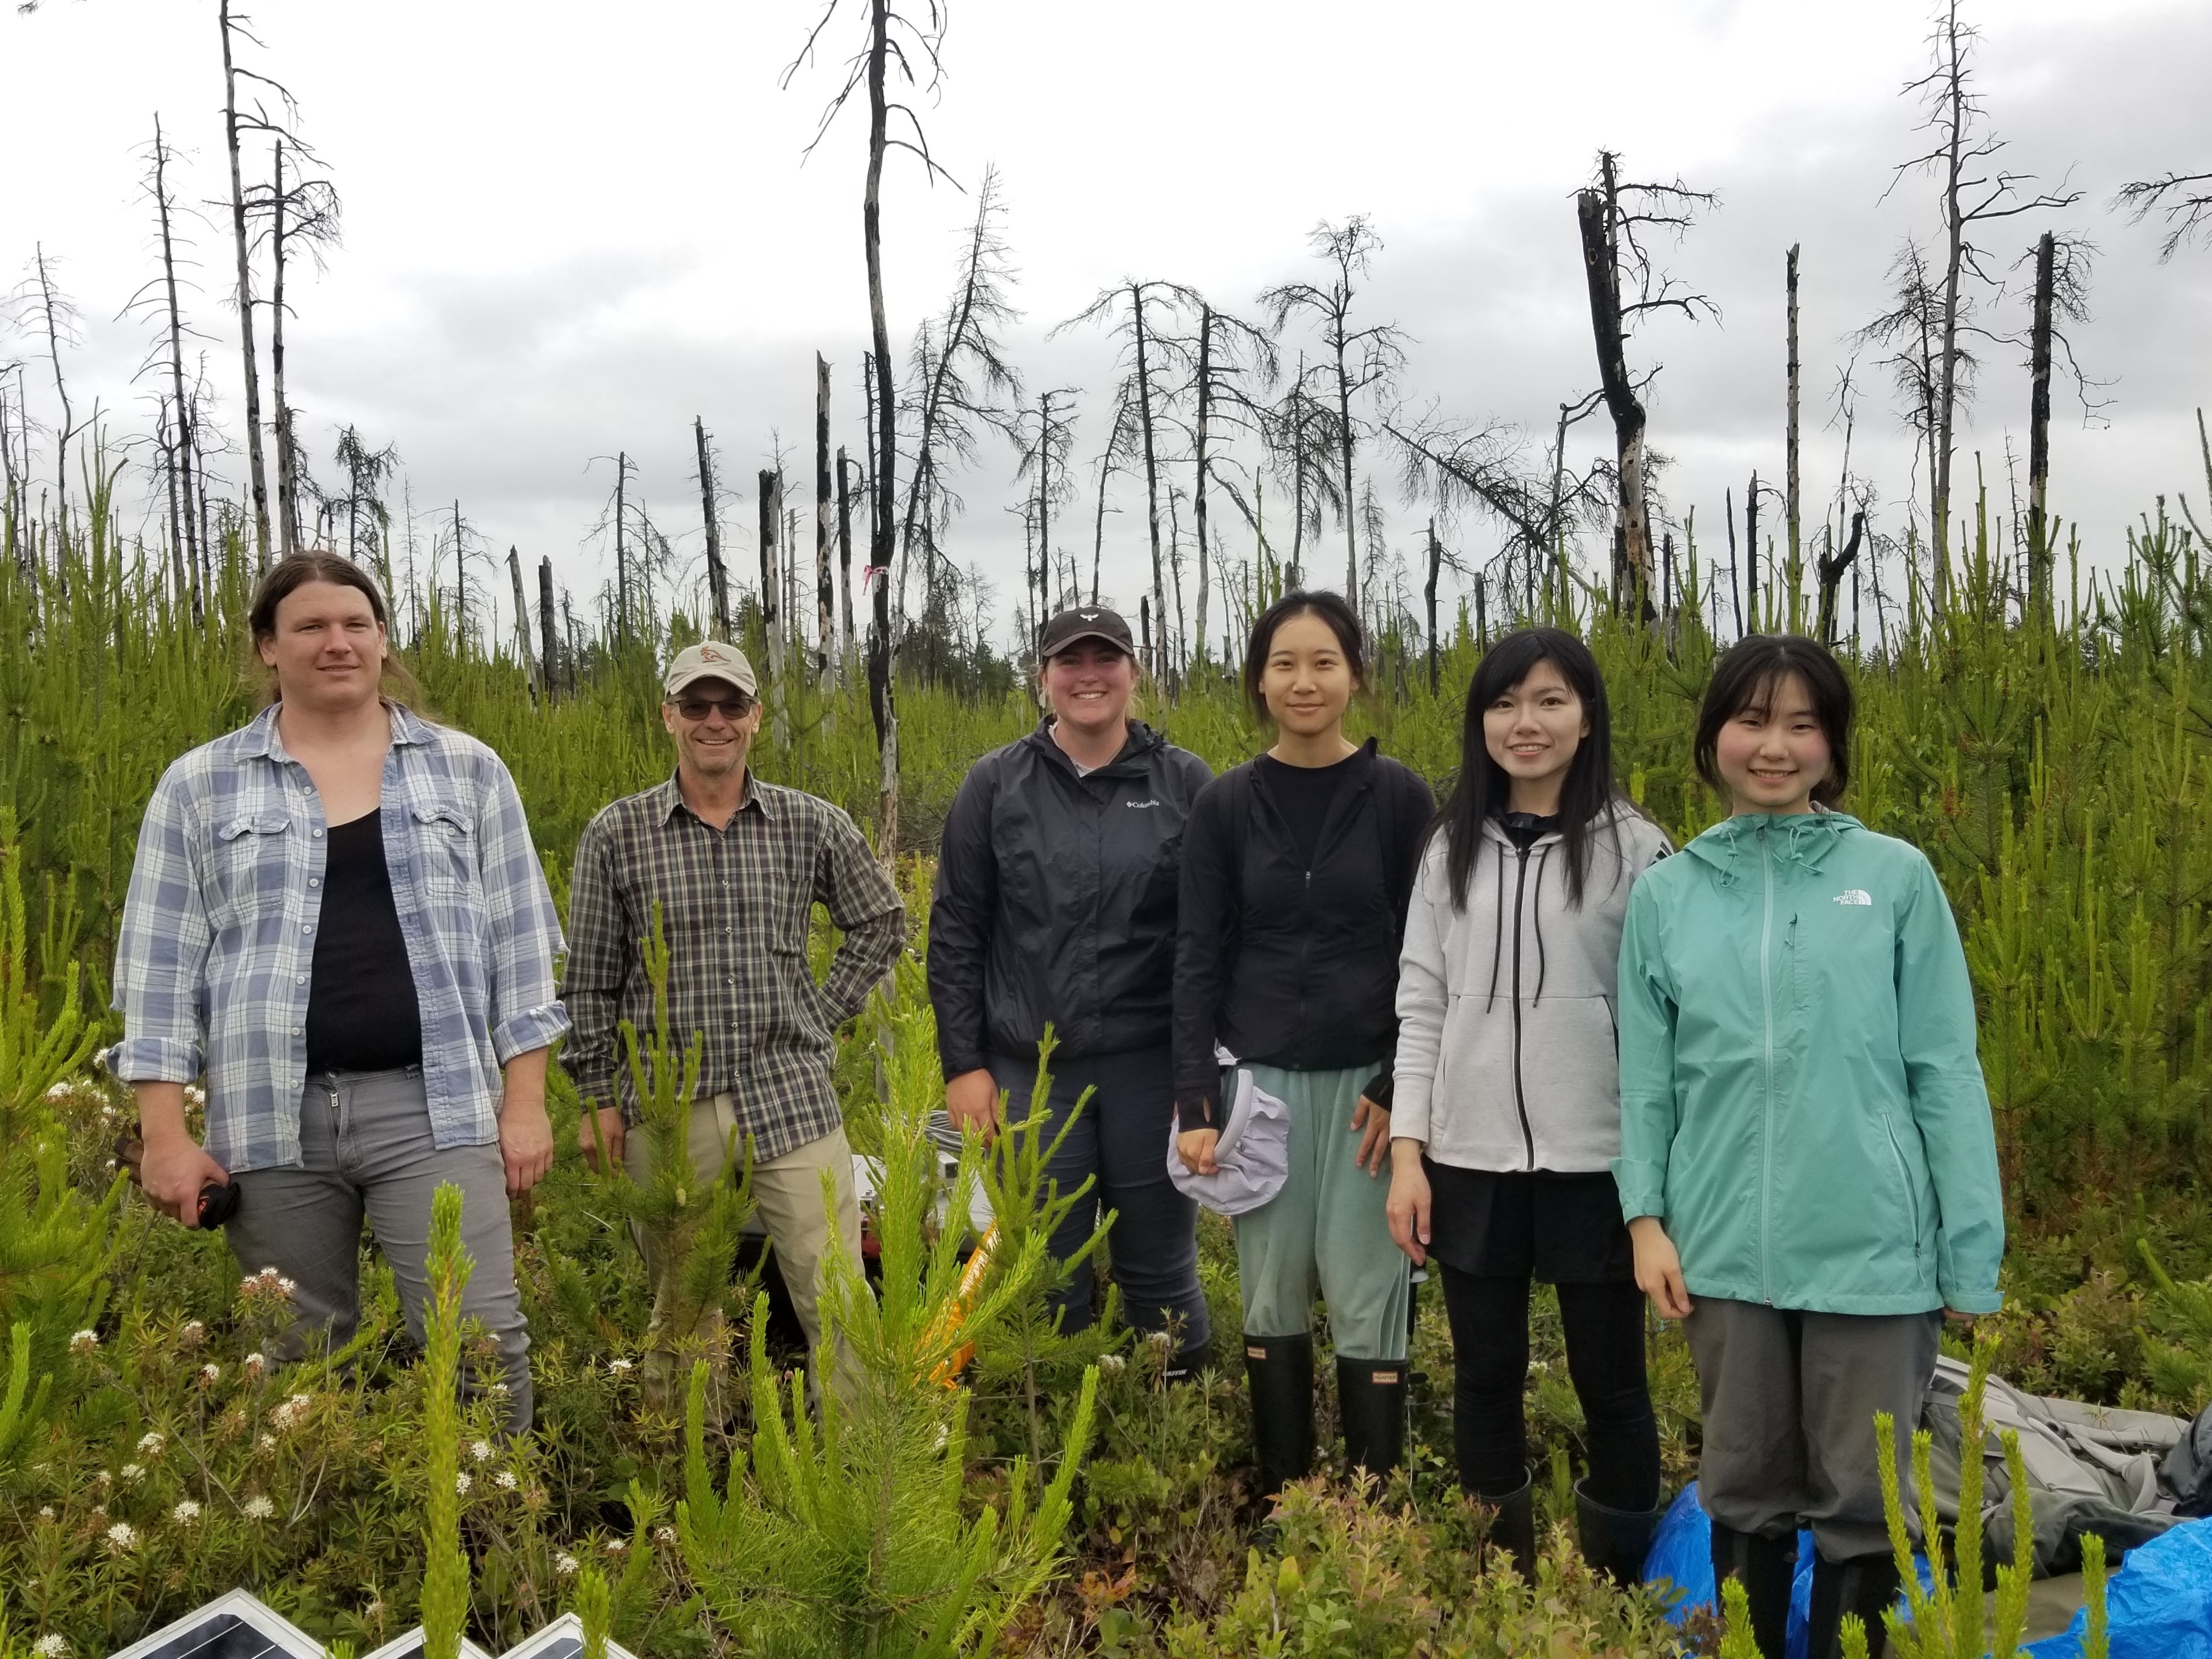
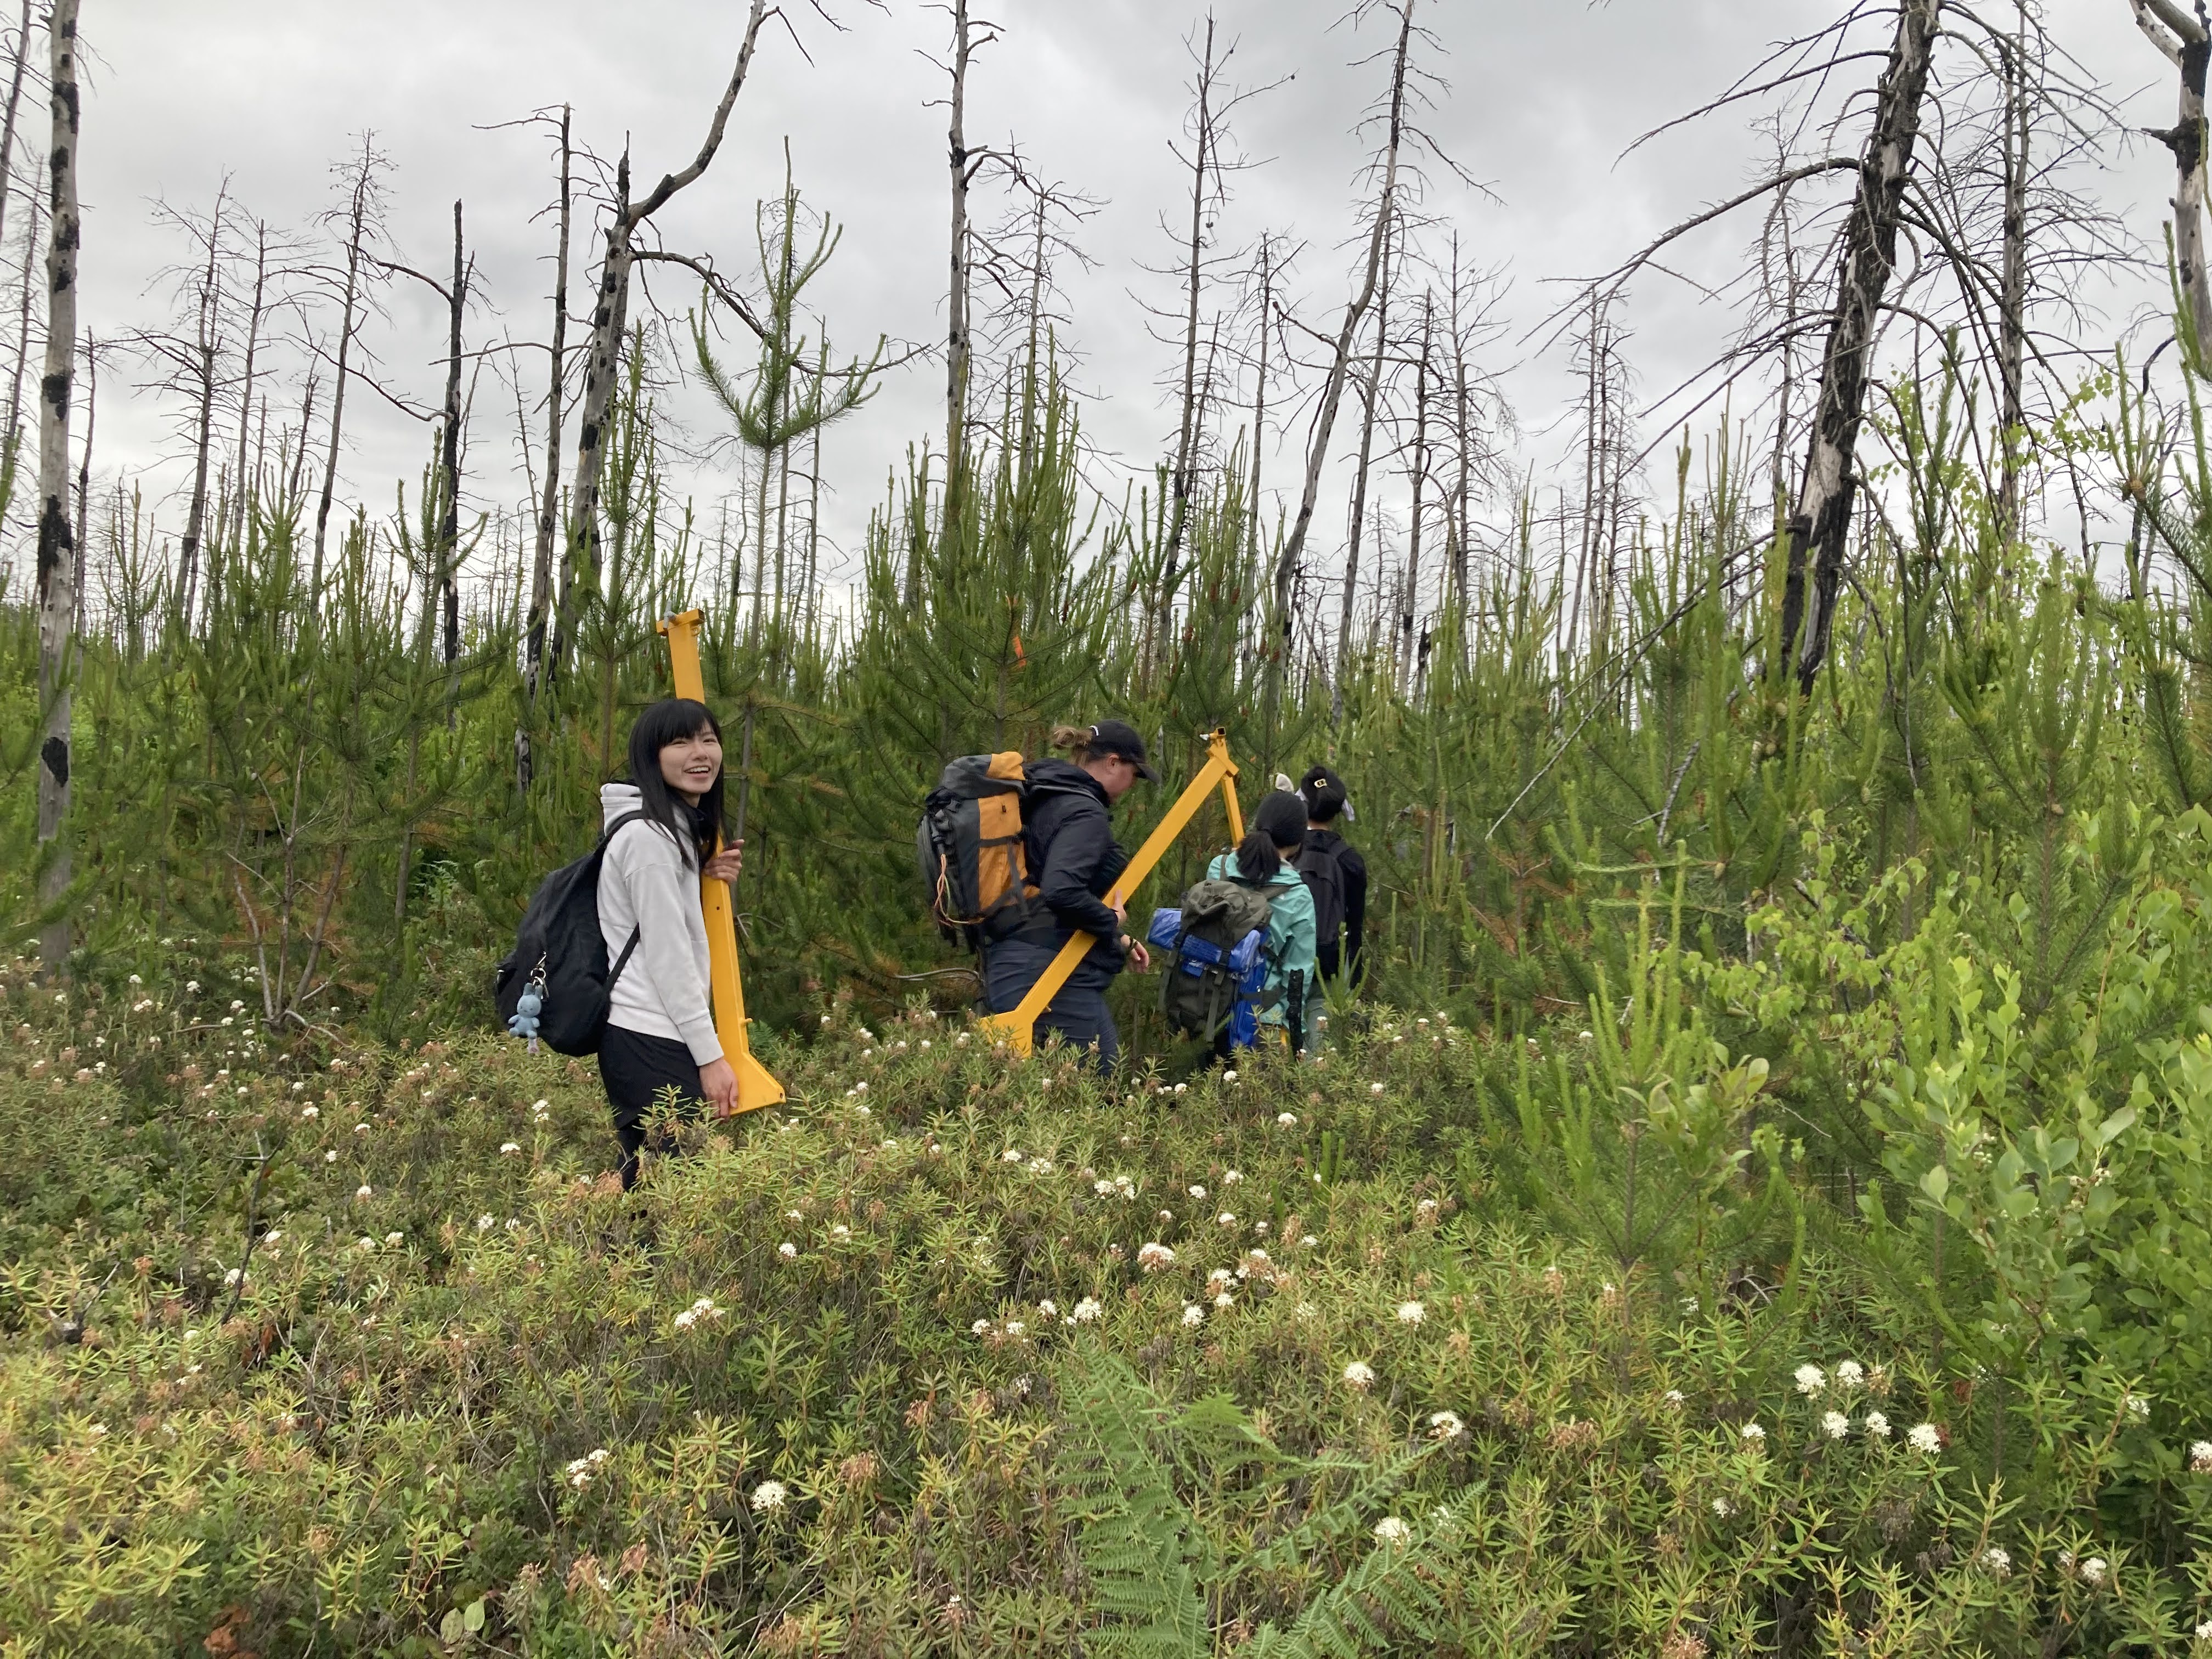
Mobile BBS Flux Tower
In spring/summer 2023 I designed and deployed a light-weight EC system mounted on a telescoping tripod to measure CO2, water, and energy fluxes over a 7-year old stand of lodgepole pine seedlings in Burn’s Bog that sprouted following a fire in 2016. The tower will operate through the fall until the sun/cloud conditions become unfavorable for solar power generation. We will restart observations in late winter 2024.
Flux Footprint Mapping
I’ve developed a python based tool for creating flux footprints web maps using the Kljun et al. (2015) flux footprint prediction (FFP) model. Given half-hourly turbulence conditions and metadata for a site, this wrapper will calculate the FFP on a per-time-step basis, and output FFP contours over desired intervals in this web-map format. If provided a landscape classification map, the program will also overlay each timestep’s footprint with the map. This allows the user to estimate the relative source contrition of different ecosystem components in some heterogeneous ecosystems. Figure 1 shows an example of the web map output for the Burns Bog 2 EC station. You can find more information and links to its github repository here.
Arctic Carbon Fluxes
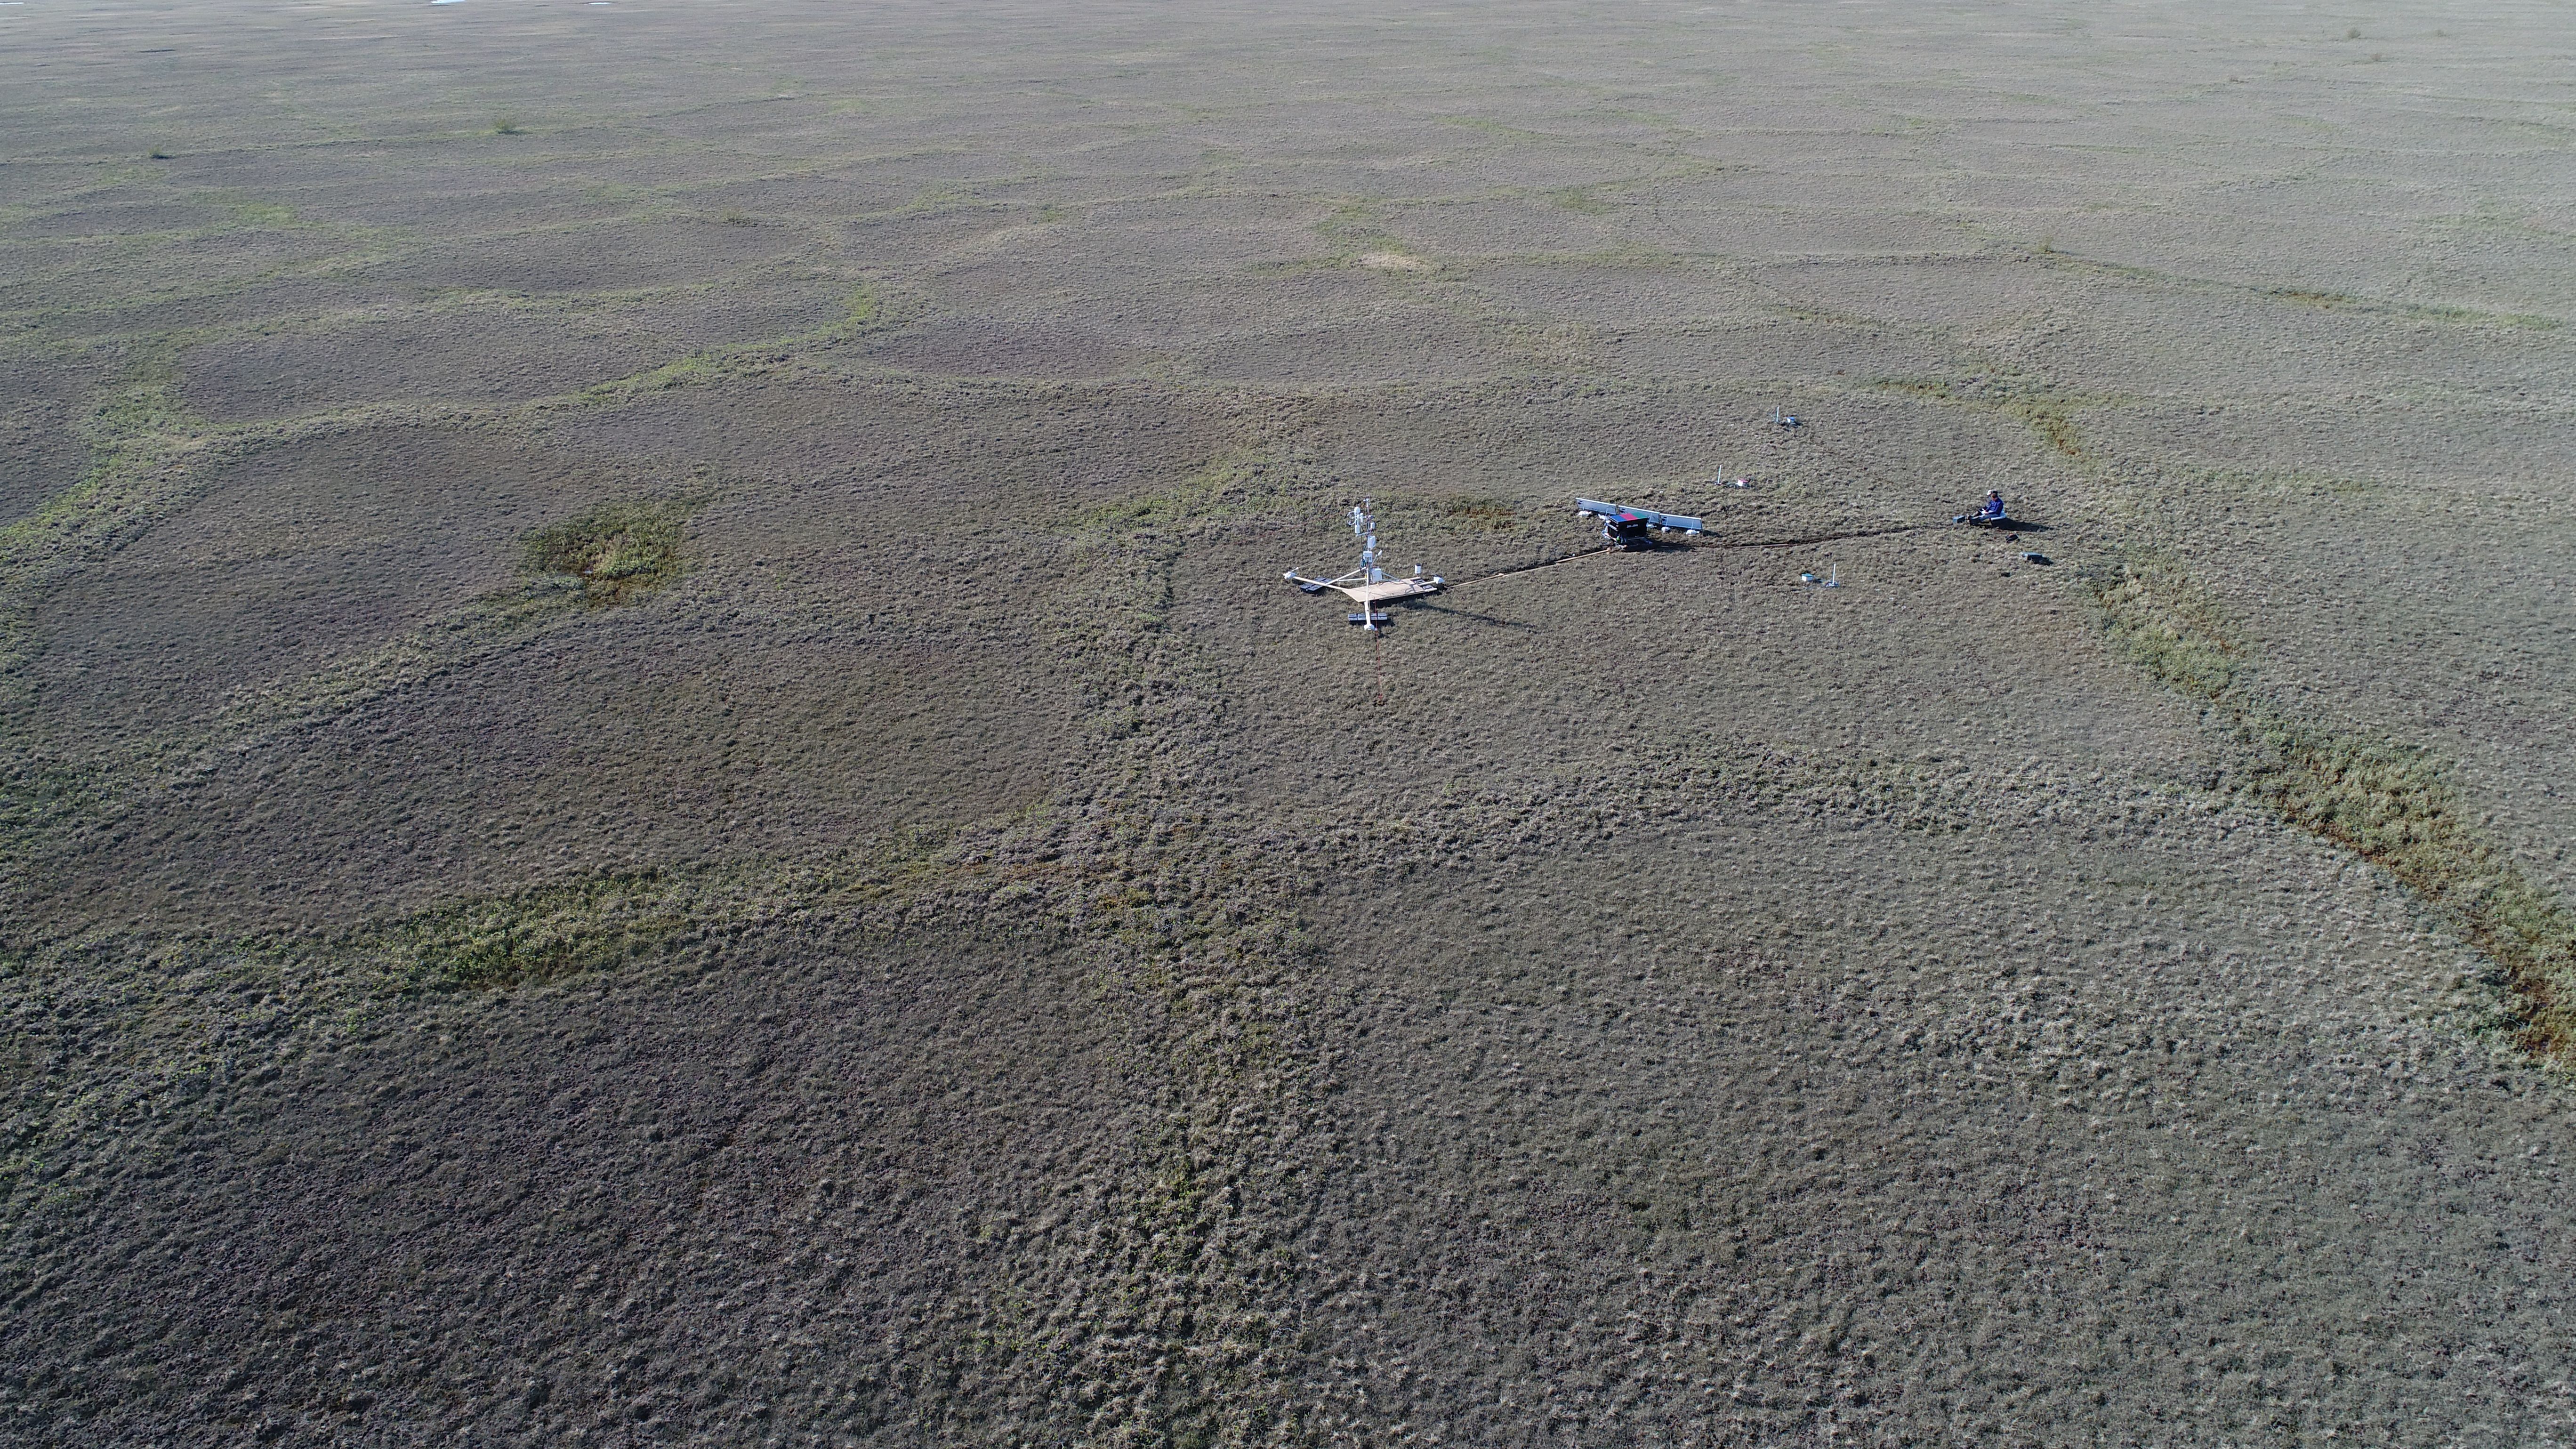
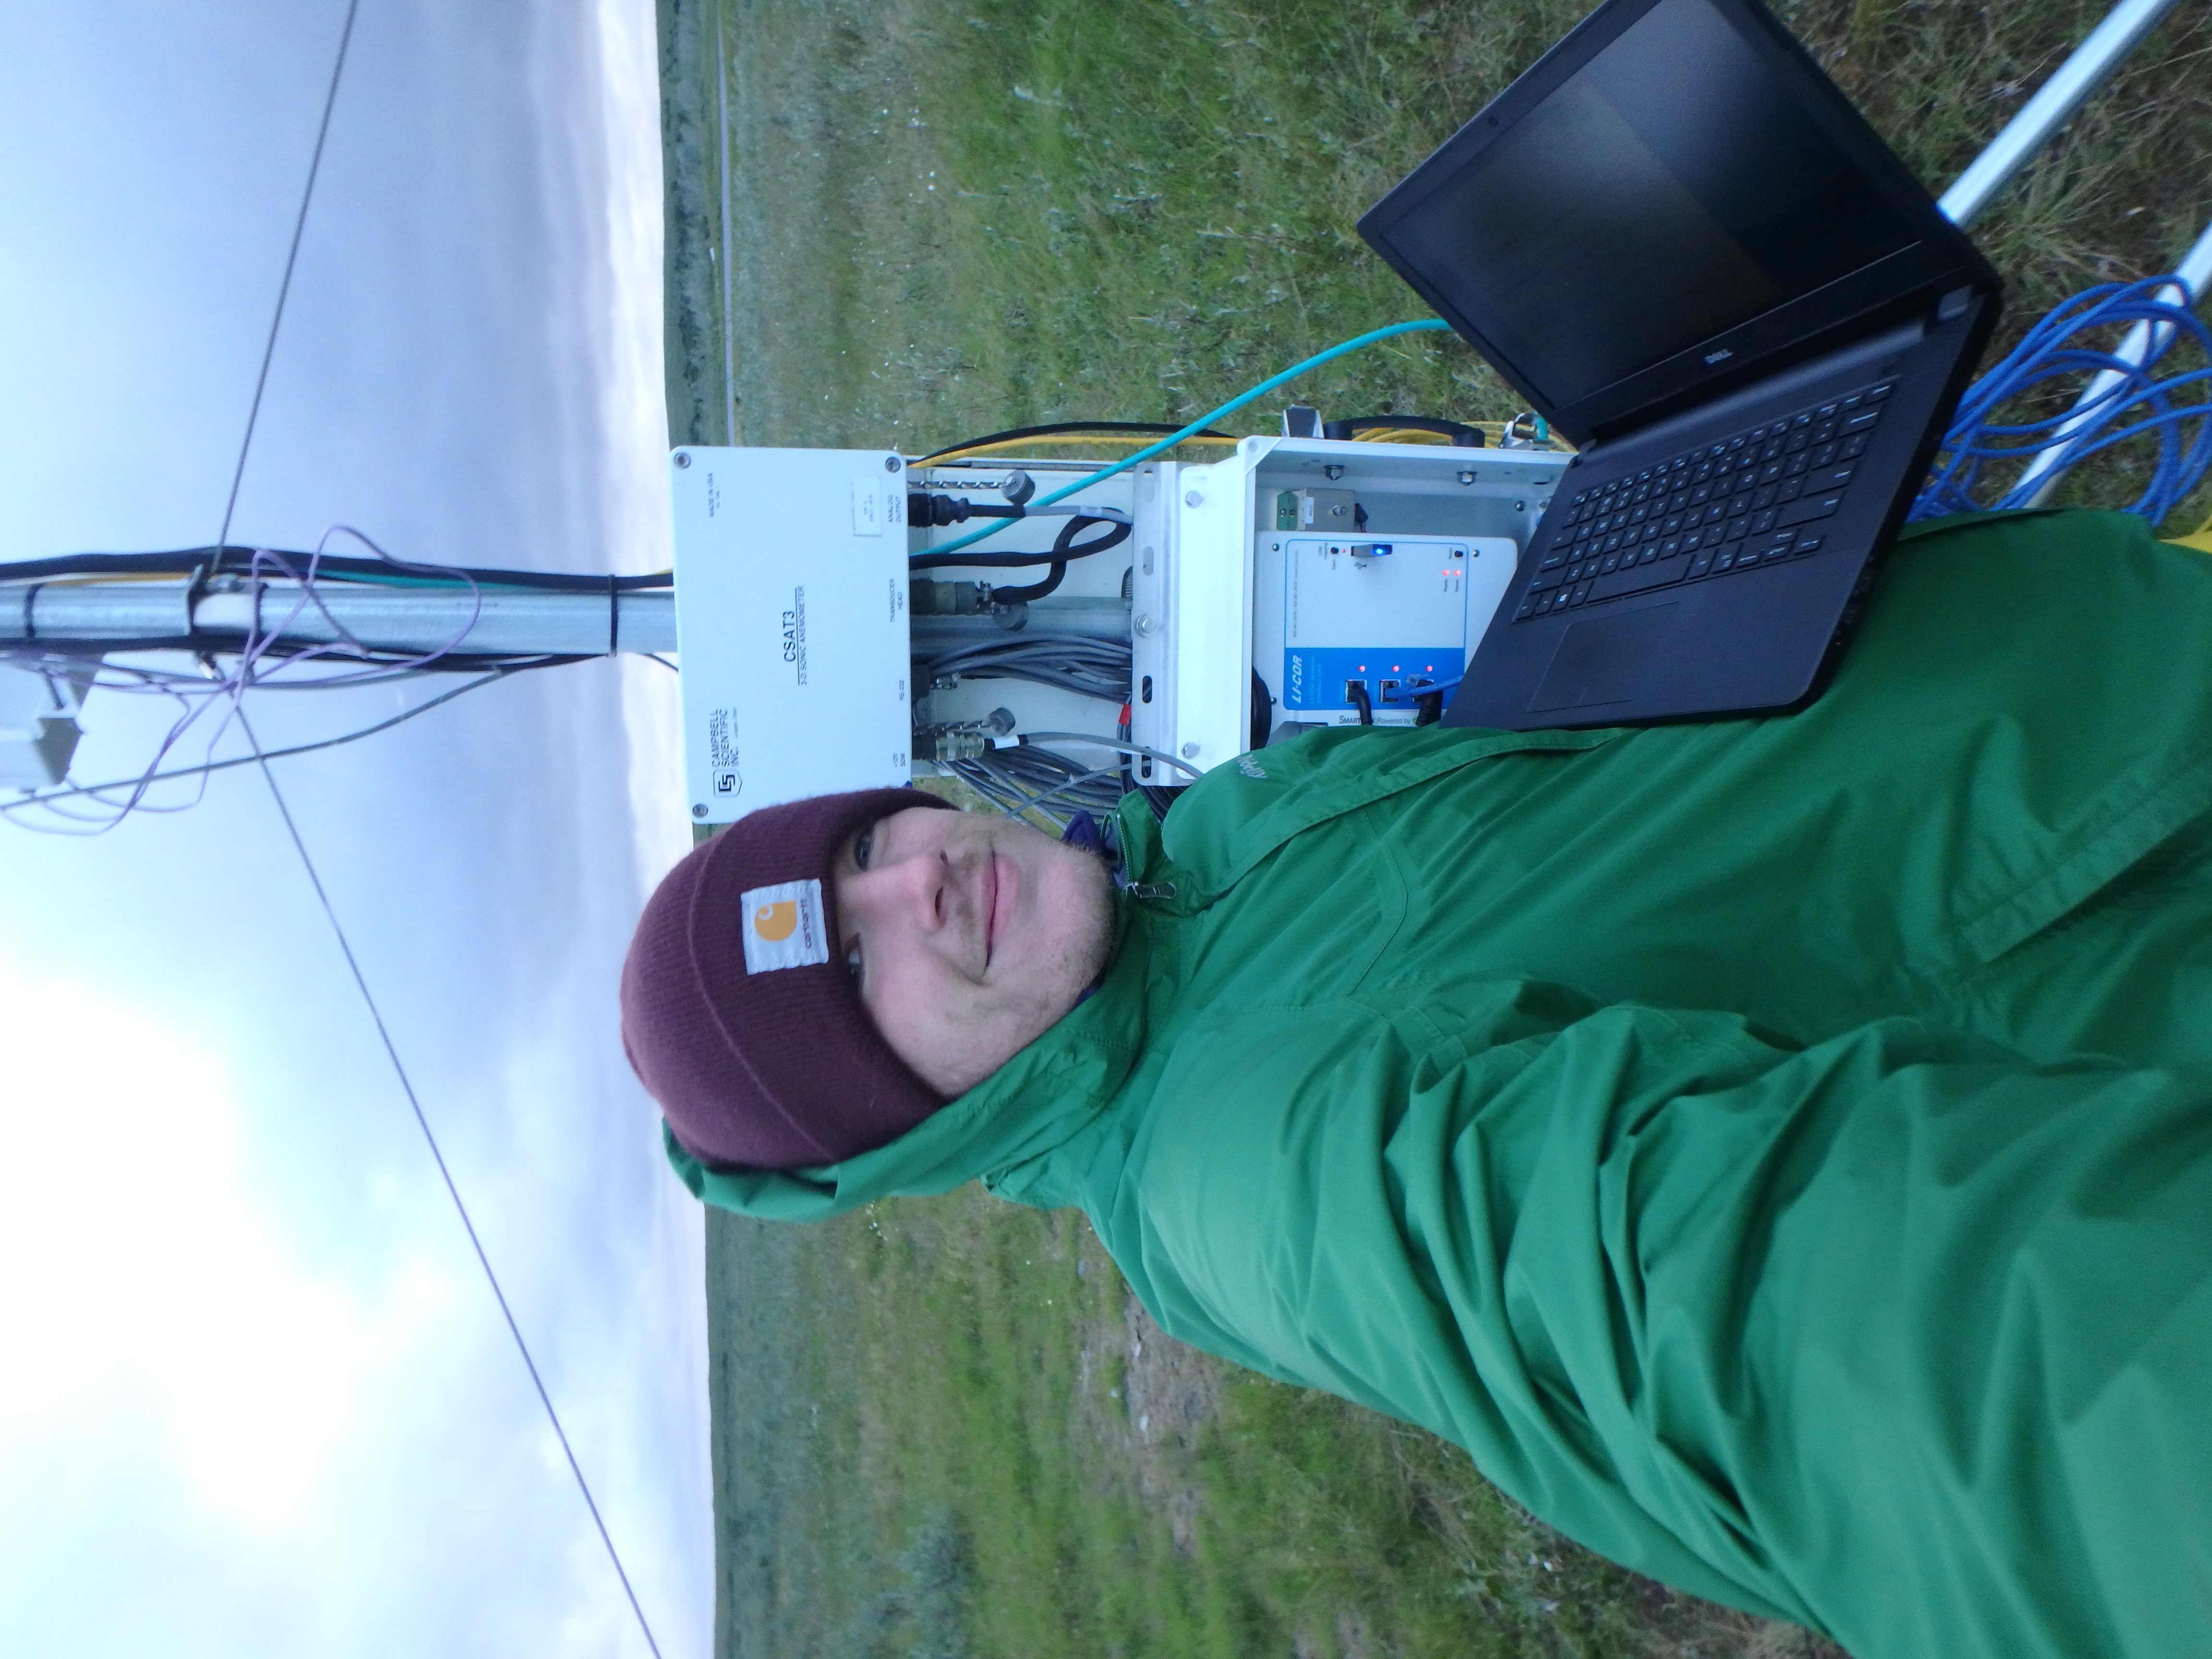
For my PhD research, I studied carbon fluxes in wetland ecosystem in the Mackenzie Delta Region. I conducted two field seasons of research. In 2016 I worked at Illisarvik, an artificially drained thermokarst lake on Richard’s Island, NWT. Then in 2017 I installed an EC station at Fish Island, a low-center polygon ecosystem in the Mackenzie River Delta.
Teaching
I have been working as a sessional instructor at UBC since 2020. In November 2022, I was given an “Open Educational Resource Champion” award for publishing all my course materials as Open Educational Resource (OER) on Github.
- I feel this is the most effective, transparent, and accessible way I can provide content for my students.
- I find the institutional tools provided by UBC (e.g., Canvas) to be lacking in functionality and flexibility; they also pose an obvious barrier to accessibility.
- By using Github I can tailor my course webpage as I see fit, prospective students can review this syllabus and other content to see if they might be interested in the course, and students will continue to have access the course content even after they graduate!
Courses
From Summer 2020 to Summer 2023, I taught Geographic Information Science. You can find the website for the most recent term of the course here. As of Fall 2023, I am teaching “Atmospheric Environments”, which is an introductory level course focusing on the dynamics governing the weather and climate. The course website can be found here. In Winter 2023, I will be teaching “Microscale Weather and Climate”, a 300 level course focusing on ecosystem scale weather and climate dynamics and how they influence the global climate system.
Evaluations
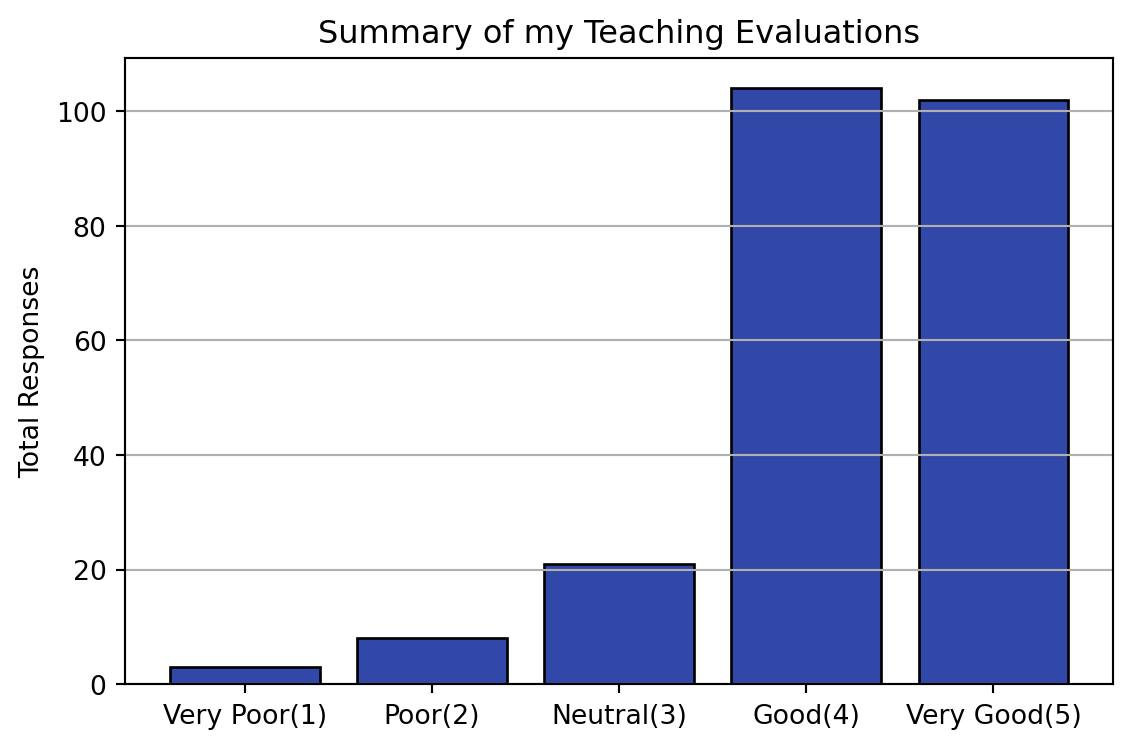
All of my available teaching evaluations are posted here. Thus far these evaluations only cover GEOS 270 (Geographic Information Science). I will post my evaluations for GEOS 200 and GEOS 300 when they become available. The wording of the evaluation questions has changed between terms, but one key question has not changed: Considering everything, how would you rate this course? Over the course of my teaching career, the interpolated median of responses to this question is 4.39/5 and my favorability rating (percentage of 4s and 5s) is 88%.
| Year | Term | Section | N | n | Very Poor(1) | Poor(2) | Neutral(3) | Good(4) | Very Good(5) | Response Rate |
|---|---|---|---|---|---|---|---|---|---|---|
| 2020 | S1 | 921 | 70 | 37 | 0 | 1 | 2 | 20 | 14 | 0.53 |
| 2020 | W2 | 201 | 76 | 27 | 0 | 0 | 2 | 11 | 14 | 0.36 |
| 2020 | W2 | 202 | 69 | 20 | 0 | 1 | 3 | 9 | 7 | 0.29 |
| 2021 | W1 | 101 | 97 | 41 | 2 | 3 | 2 | 19 | 15 | 0.42 |
| 2021 | W2 | 201 | 45 | 11 | 0 | 0 | 1 | 6 | 4 | 0.24 |
| 2022 | S1 | 921 | 33 | 4 | 0 | 0 | 0 | 0 | 4 | 0.12 |
| 2022 | W1 | 101 | 94 | 33 | 1 | 1 | 1 | 9 | 21 | 0.35 |
| 2023 | S1 | 921 | 47 | 15 | 0 | 0 | 2 | 7 | 6 | 0.32 |
| 2023 | W1 | 101 | 125 | 50 | 0 | 2 | 8 | 23 | 17 | 0.4 |
| 2023 | W2 | 101 | 56 | 20 | 0 | 1 | 4 | 8 | 7 | 0.36 |