Raster Analysis
Raster overlays, key operations and techniques.
Raster Analysis
Many operations can be done with vector data.
- Some methods are very similar.
- Distinctions between methods can be subtle, but important.
- Can complete the same tasks, but need slight changes to a workflow.
- Typically in GIS there are multiple ways to get the same answers.
- Some "routes" are just more direct.
Parsing and Aggregating
Often our data is more "complex" than we need it to be. It is useful to parse, reclassify, and/or aggregate our data.
- Clip Raster: cuts raster down to a bounding box.
- Max N/S & E/W extent of another layer (vector or raster) or manually defined.
- Reclassify: reassign cell values.
- Mosaic: Combine multiple raster data sets into one.
- There are multiple approaches we can use.
Overlay
Often, we have multiple data layers and we want to combine them to form a new output. With raster data, we have a few tools we can use for this.
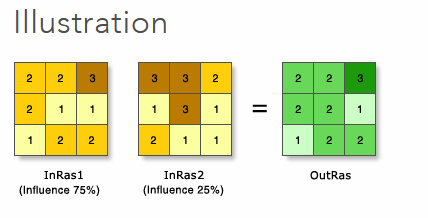
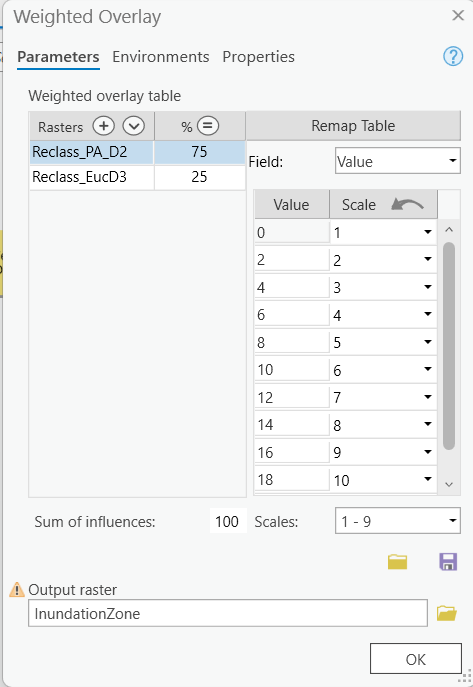
Weighted Overlay
Combine multiple layers for suitability or risk analysis. Suitable alternative for the Port Alberni Tsunami Modelling
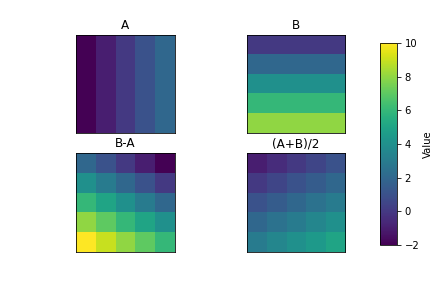
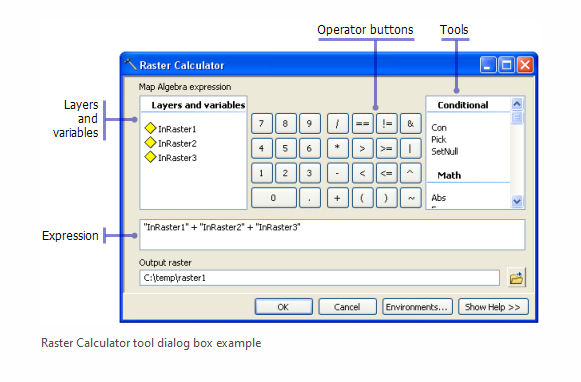
Raster Calculator
More general than weighted overlay, can be used to do weighted overlay if combined with reclassification. Suitable alternative for the Port Alberni Tsunami Modelling.
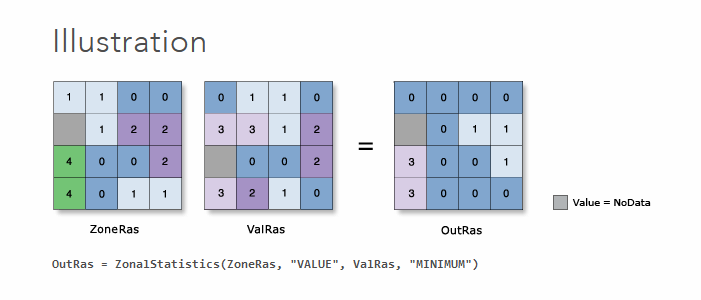
Zonal Statistics
Calculate a single statistic value (mean, max, etc.) using zones (regions); output desired statistic by zone.
- The zone can be either another a raster or vector layer.
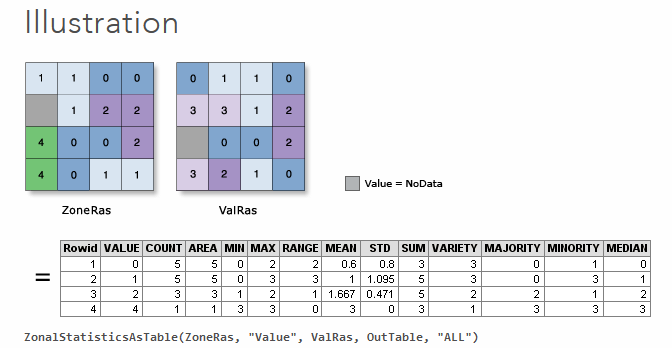
- Zonal Statistics as Table generates a table containing multiple statistics by zone.
Proximity Analysis
Sometimes, we're interested in looking at spatial relationships using raster data.
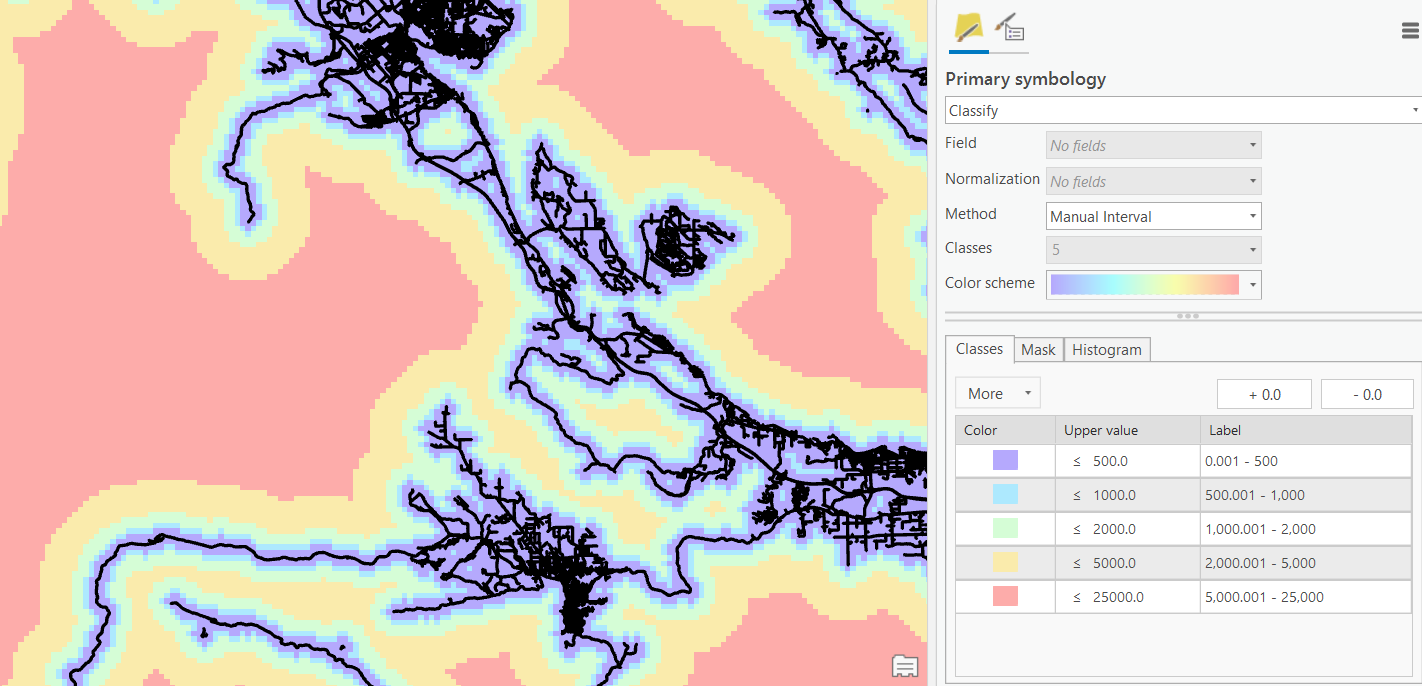
- Euclidean Distance: use this tool to calculate distance from the nearest feature or raster layer.
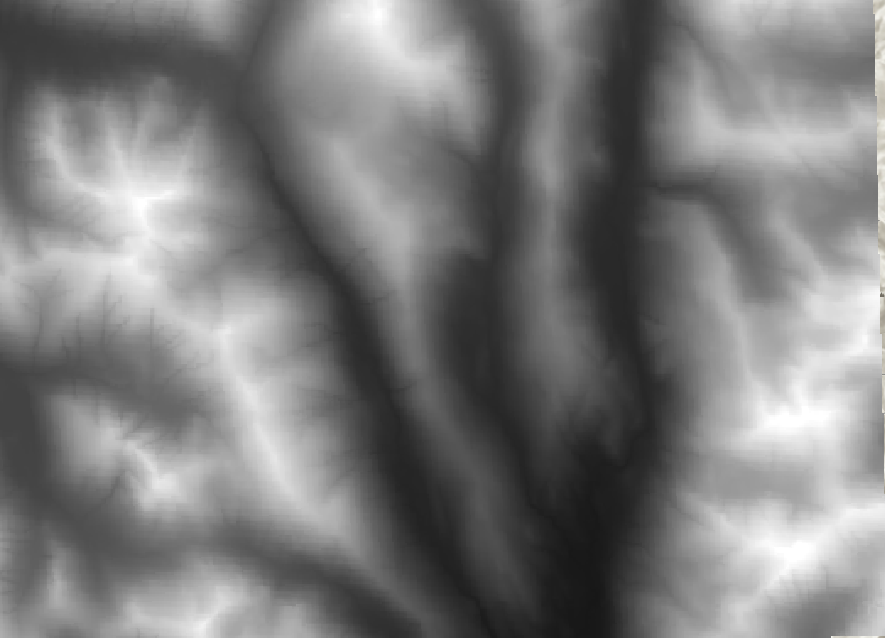
Surface Analysis
These tools are specifically designed to analyze terrain surfaces (ie. Digital Elevation Models), however, they can be applied to other purposes in select applications.
Surface Analysis
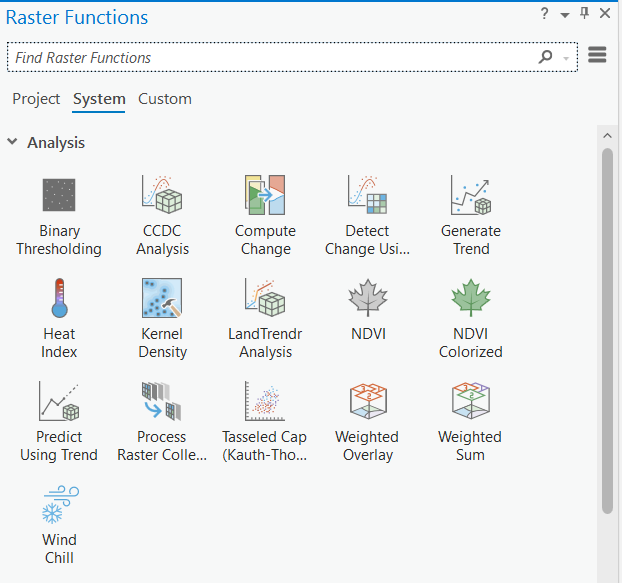
Raster Functions
ArcGIS Pro has an extensive toolkit of tools for more complex analyses you can do with raster data as well.
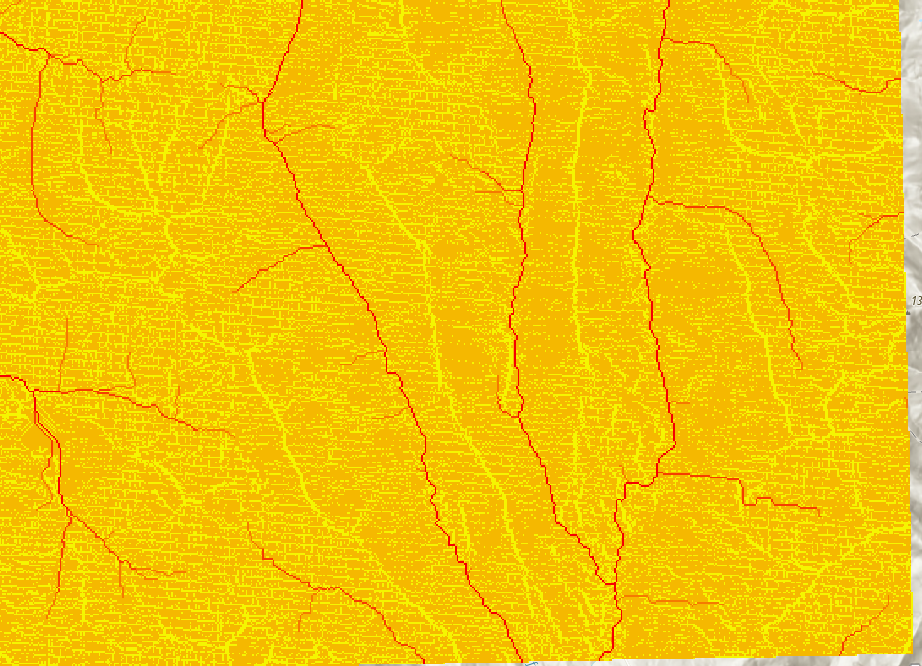
Hydrologic Modelling
The Hydrology toolset can be used to calculate stream flow.
- Use a DEM as an input
- Fill "sinks"
- Calculate flow direction
- Run flow accumulation